The U.S. economy continued its slow but steady recovery in November, leaving room for policymakers to enact policies that could accelerate job creation and economic growth. The current budget negotiations in Congress offer such an opportunity to create a pro-growth budget and end the fiscal uncertainty that has hampered business investment over the past two and a half years.
Faster growth requires sharper increases in business investments. New analysis from the Center for American Progress, however, shows that businesses slowed the pace of investing in late 2011 and further slowed it in 2013, as Congress hobbled from one fiscal crisis to the next manufactured by radical conservatives. The fiscal uncertainty slowed investment growth from an already modest pace. Moreover, business investment has also been slow because of slow income growth; that is, families are not increasing consumption fast enough to warrant faster investments.
Businesses have the wherewithal to invest more. Profits are hovering near prerecession highs after recovering quickly from the depths of the Great Recession. However, corporations have kept much of this additional money in near-record stockpiles of cash, or have used it to keep shareholders happy through stock repurchases and dividend payouts. Investing in new equipment such as computers and trucks and structures such as manufacturing plants and office buildings has been a lower priority.
But policymakers can help grow our economy. This requires focusing on faster wage and income growth, investing in both short-term and long-term American competitiveness, and ending fiscal brinksmanship. In short, it requires enacting the smart progressive policies contained in CAP’s landmark report, “300 Million Engines of Growth,” published in June.
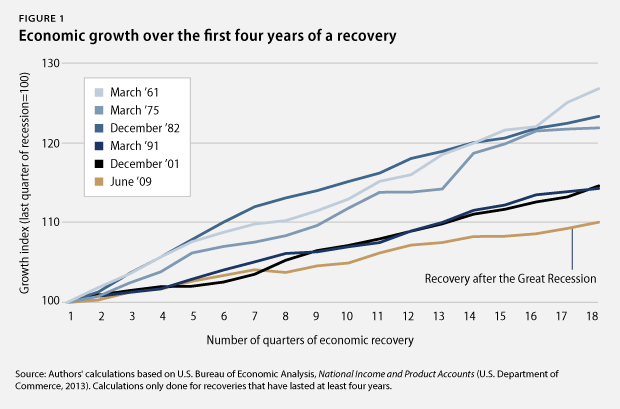
With positive signs in this month’s labor report and upward revisions over the past few months, it is becoming increasingly evident that the existing recovery is stable, but not robust enough to gain necessary momentum to quickly lower the unemployment rate and raise living standards for millions of struggling families. Focusing on job creation and investment expansions rather than harmfully disruptive fiscal squabbles can create a much stronger and self-sustaining economic recovery.
1. The economy continues to grow slowly. Gross domestic product, or GDP, increased in the third quarter of 2013 at an inflation-adjusted annual rate of 2.8 percent. Domestic consumption increased by an annual rate of 1.5 percent, housing spending substantially grew by 14.6 percent, while business investment growth slowed to 1.6 percent. Exports increased by 4.5 percent in the first quarter and government spending was essentially flat with an increase of only 0.2 percent. These numbers show that there is room to expand growth in all areas of the economy. Policy solutions should therefore aim to ease the strain of U.S. fiscal austerity on the economy, create fiscal certainty, and invest in people, infrastructure, and innovation.
2. The moderate labor-market recovery continues in its fourth year. There were 6 million more jobs in October 2013 than in June 2009. The private sector added 6.7 million jobs during this period. The loss of more than 621,000 state and local government jobs explains the difference between the net gain of all jobs and the private-sector gain in this period. Budget cuts reduced the number of teachers, bus drivers, firefighters, and police officers, among others. Job creation should be a top policy priority, since private-sector job growth is still too weak to quickly overcome other job losses and rapidly lower the unemployment rate. A reorientation of tax and spending policies to strengthen economic growth, rather than a blind obsession with deficit reduction at all costs, could create millions of jobs that America’s middle class desperately needs.
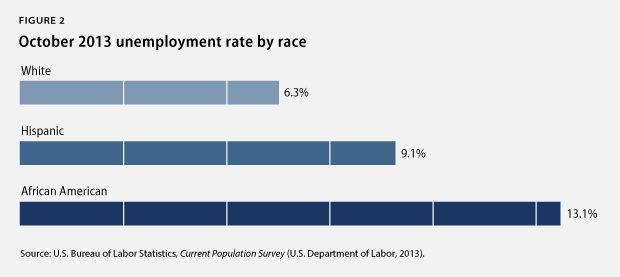
3. Some communities continue to struggle disproportionately from unemployment. The unemployment rate stood at 7.3 percent in October 2013. The African American unemployment rate was 13.1 percent in October 2013, the Hispanic unemployment rate was 9.1 percent, and the white unemployment rate was 6.3 percent. Meanwhile, youth unemployment stood at 22.2 percent. The unemployment rate for people without a high school diploma ticked up to 10.9 percent, compared to 7.3 percent for those with a high school degree, 6.3 percent for those with some college education, and 3.8 percent for those with a college degree. Population groups with higher unemployment rates have struggled disproportionately more amid the weak labor market than white workers, older workers, and workers with more education. Policymakers should heed the recommendations in All-In Nation—a new book from the Center for American Progress and PolicyLink—on building a strong and diverse workforce that draws from all communities.
4. The rich continue to pull away from most Americans. Incomes of households in the 95th percentile—those with incomes of $191,000 in 2012, the most recent year for which data are available—were more than nine times the incomes of households in the 20th percentile, whose incomes were $20,599. This is the largest gap between the top 5 percent and the bottom 20 percent of households since the U.S. Census Bureau started keeping records in 1967. Median inflation-adjusted household income stood at $51,017 in 2012, its lowest level in inflation-adjusted dollars since 1995. And the poverty rate remains high, at 15 percent in 2012, as the economic slump continues to take a massive toll on the most vulnerable citizens.
5. Poverty stays high. The poverty rate remained flat at 15 percent in 2012, the most recent year for which data are available. The African American poverty rate was 27.2 percent, the Hispanic poverty rate was 25.6 percent, and the white poverty rate was 9.7 percent. The poverty rate for children under the age of 18 stood at 21.8 percent. More than one-third of African American children—37.9 percent—lived in poverty in 2012, compared to 33.8 percent of Hispanic children and 12.3 percent of white children. The prolonged economic slump, following an exceptionally weak labor market before the crisis, has taken a massive toll on our country’s most vulnerable citizens.
6. Employer-sponsored benefits disappear. The share of people with employer-sponsored health insurance dropped from 59.8 percent in 2007 to 54.9 percent in 2012, the most recent year for which data are available. The share of private-sector workers who participated in a retirement plan at work fell to 39.2 percent in 2011, down from 42 percent in 2007. Families now have less economic security than in the past due to fewer employment-based benefits, which requires that they have more private savings to make up the difference.
7. Family wealth losses still linger. In June 2013, total family wealth was down $1.5 trillion in 2013 dollars from March 2007, its previous peak. On average, homeowners own only 49.8 percent of their homes—compared to the long-term average of 61 percent before the Great Recession—with the rest owed to banks. Homeowners’ massive debt slows household-spending growth, as households still have little collateral for banks to loosen their lending standards and households spend less than they otherwise would on new homes and other big-ticket items.
8. Household debt is still high. Household debt equaled 104.3 percent of after-tax income in June 2013, down from a peak of 129.5 percent in December 2007. Household debt has hovered around 105 percent of after-tax income for one year now. That is, the unprecedented deleveraging—debt decline—trend that marked the Great Recession has stopped. A return to debt growth outpacing income growth, which was the case prior to the start of the Great Recession in 2007, from already-high debt levels could eventually slow economic growth again. This would be especially true if interest rates also rise from historically low levels due to a change in the Federal Reserve’s policies and crowd out household spending on other items.
9. The housing market continues to recover from historic lows. New home sales amounted to an annual rate of 421,000 in August 2013—a 12.6 percent increase from the 374,000 homes sold in August 2012 but well below the historical average of 698,000 homes sold before the Great Recession. The median new-home price in August 2013 held steady from one year earlier. Existing-home sales were up by 6 percent in October 2013 from one year earlier, and the median price for existing homes was up by 12.8 percent during the same period. Home sales have to go a lot further, given that homeownership in the United States stood at 65.3 percent in the third quarter of 2013, down from 68.2 percent before the recession. The current homeownership rates are similar to those recorded in 1996, well before the most recent housing bubble started. Though the housing-market recovery started later than the wider economic recovery—and started out at a record low—lately the housing market has contributed a much-needed boost to economic progress. As such, there is still plenty of room for the housing market to provide more stimulation to the economy more broadly. The fledgling housing recovery could gain further strength if policymakers support economic growth and job creation at the same time.
10. Corporate profits stay high near pre-crisis peaks. Inflation-adjusted corporate profits were 84.5 percent larger in June 2013 than in June 2009, when the economic recovery started. The after-tax corporate-profit rate—profits to total assets—stood at 3.2 percent in June 2013, nearing the previous peak after-tax profit rate of 3.3 percent that occurred prior to the Great Recession. But business investment remains low at the same time, suggesting that businesses are hoarding cash and using their resources for executive compensation and overseas acquisitions instead.
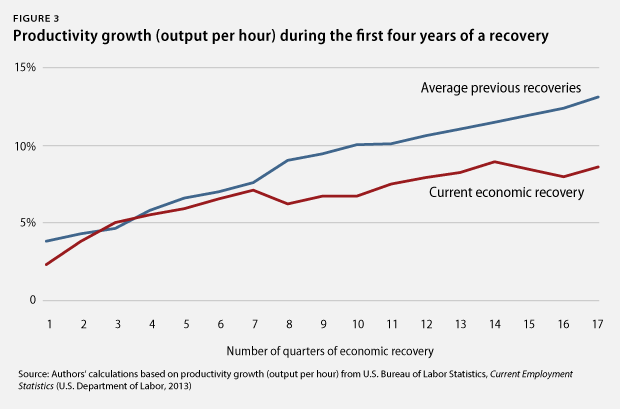
11. Improvements in U.S. competitiveness lag behind previous business cycles. Productivity growth, measured as the increase in inflation-adjusted output per hour, is key to increasing living standards. U.S. productivity has risen by 8.7 percent from June 2009 to June 2013, the first four years of the economic recovery since the end of the Great Recession. This compares to an average of 13.1 percent during all previous recoveries of at least equal length. Only one previous recovery had slightly slower productivity growth than the current one, while all others saw much faster growth than is the case in this recovery. That is, productivity expanded more than 50 percent faster in the past than during the current recovery.
12. Corporate priorities do not lie with investments. Nonfinancial corporations spent on average 93.1 percent of their after-tax profits between December 2007—when the Great Recession started—and June 2013 on dividend payouts and share repurchases. In short, almost all of nonfinancial corporate after-tax profits went to keep shareholders happy during the current business cycle. Nonfinancial corporations also held on average 5.3 percent of all of their assets in cash—the highest average share since the business cycle that ended in December 1969. And nonfinancial corporations spent on average 171.4 percent of their after-tax profits—by selling other assets and by borrowing—on capital expenditures or investments. This was the lowest ratio since the business cycle that ended in 1960. U.S. corporations have prioritized keeping shareholders happy and building up cash over investments in structures and equipment.
Christian E. Weller is a Senior Fellow at the Center for American Progress and a professor in the Department of Public Policy and Public Affairs at the McCormack Graduate School of Policy and Global Studies at the University of Massachusetts Boston. Sam Ungar is a Research Assistant at the Center.