The economic data for March suggest a pressing need for policy attention on economic growth and the labor market. The economy and the labor market continue to grow at a modest pace with the result that many people are financially struggling, even as the economic recovery that started in June 2009 is closing in on completing its fifth year.
A range of new policies are necessary to boost economic growth and employment. Macroeconomic policy since 2012 has rested largely with monetary policy. The Federal Reserve has kept short-term interest rates low and undertaken a series of unprecedented bond purchases to stabilize major credit markets such as mortgage markets. But low interest rates alone have not been enough to create a robust economic recovery with quickly rising incomes and employment. A number of additional policies—such as investments in infrastructure and education, extended unemployment benefits, and a higher minimum wage—are necessary to boost economic and job growth. Such policies are also gaining added importance as the Federal Reserve is gradually preparing to tighten monetary policy with higher interest rates and fewer bond purchases. This leaves a void that needs to be filled against the backdrop of a subpar economic recovery that has benefited in large part only upper income households and corporate profits.
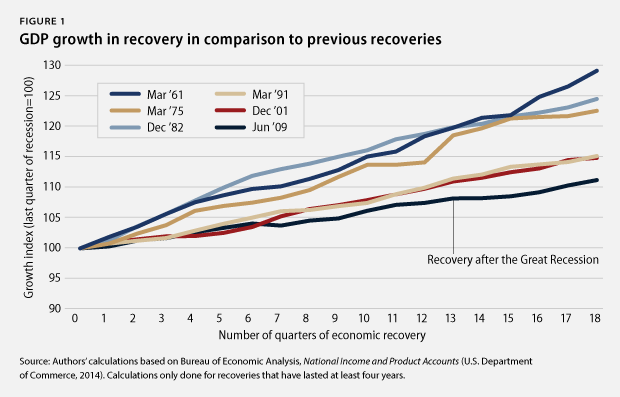
1. Economic growth lags behind previous recoveries. Gross domestic product, or GDP, increased in the fourth quarter of 2013 at an inflation-adjusted annual rate of 2.4 percent. Domestic consumption increased by an annual rate of 2.6 percent, and housing spending substantially shrank by 8.7 percent, while business investment growth grew at a rate of 7.3 percent. Exports increased by 9.4 percent in the first quarter, and government spending decreased by 5.6 percent. The economy expanded by 11 percent from June 2009 to December 2013—its slowest expansion during recoveries of at least equal length. Policymakers need to focus on strengthening key parts of economic growth, particularly investment and exports, with targeted measures that go beyond removing fiscal uncertainty.
2. Improvements to U.S. competitiveness lag behind previous business cycles. Productivity growth, measured as the increase in inflation-adjusted output per hour, is key to increasing living standards. U.S. productivity rose by 7.3 percent from June 2009 to December 2013, the first 18 quarters of the economic recovery since the end of the Great Recession. This compares to an average of 11.9 percent during all previous recoveries of at least equal length. No previous recovery had lower productivity growth than the current one. Productivity growth is the main driving force behind the country’s ability to raise living standards. Weaker productivity growth than in the past will make it harder to build a strong middle class, requiring policymakers’ attention to invest in U.S. competitiveness.
3. The housing market continues to recover from historic lows. New-home sales amounted to an annual rate of 468,000 in January 2014—a 2.2 percent increase from the 458,000 homes sold in January 2013 but well below the historical average of 698,000 homes sold before the Great Recession. The median new-home price in January 2014 was $260,100, up from one year earlier. Existing-home sales were down by 7.1 percent in February 2014 from one year earlier, but the median price for existing homes was up by 9.1 percent during the same period. Home sales have to go a lot further, given that homeownership in the United States stood at 65.2 percent in the fourth quarter of 2013, down from 68.2 percent before the recession. The current homeownership rates are similar to those recorded in 1996, well before the most recent housing bubble started. Although the housing-market recovery started later than the wider economic recovery—and started out at a record low—the housing market has lately contributed a much-needed boost to economic progress. As such, there is still plenty of room for the housing market to provide more stimulation to the economy more broadly. The fledgling housing recovery could gain further strength if policymakers support economic growth and job creation at the same time.
4. Moderate labor-market recovery shows less job growth than in previous recoveries. There were 6.8 million more jobs in February 2013 than in June 2009. The private sector added 7.5 million jobs during this period. The loss of nearly 630,000 state and local government jobs explains the difference between the net gain of all jobs and the private-sector gain in this period. Budget cuts reduced the number of teachers, bus drivers, firefighters, and police officers, among others. The total number of jobs has now grown by 5.2 percent during this recovery, compared to an average of 12.3 percent during all prior recoveries of at least equal length. Those looking for jobs still need assistance such as extended unemployment insurance benefits.
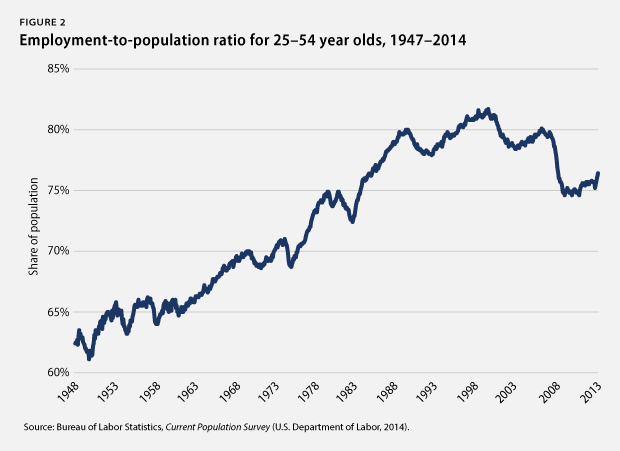
5. Employment opportunities grow very slowly for people in their prime earning years. The employed share of the population from ages 25 to 54—which is unaffected by the aging of the overall population—was 76.5 percent in February 2014. This was just above the level recorded in June 2009 and well below the levels recorded since the mid-1980s and before the Great Recession started in 2007. The employed share of the population has, on average, grown by 3.6 percentage points at this stage during previous recoveries of at least equal length. Specifically, there has been insufficient job growth to create real economic opportunities for people in the midst of their main earning years—years when they need those opportunities the most.
6. Employer-sponsored benefits disappear. The share of people with employer-sponsored health insurance dropped from 59.8 percent in 2007 to 54.9 percent in 2012, the most recent year for which data are available. The share of private-sector workers who participated in a retirement plan at work fell to 39.4 percent in 2012, down from 41.5 percent in 2007. Families now have less economic security than in the past due to fewer employment-based benefits, which requires them to have more private savings to make up the difference.
7. Some communities continue to struggle disproportionately from unemployment. The unemployment rate stood at 6.7 percent in February 2014: The African American unemployment rate was 12 percent; the Hispanic unemployment rate was 8.1 percent; and the white unemployment rate was 5.8 percent. Meanwhile, youth unemployment stood at 21.4 percent. The unemployment rate for people without a high school diploma ticked back up to 9.8 percent, compared to 6.4 percent for those with a high school degree, 6.2 percent for those with some college education, and 3.4 percent for those with a college degree. Population groups with higher unemployment rates have struggled disproportionately more amid the weak labor market than white workers, older workers, and workers with more education.
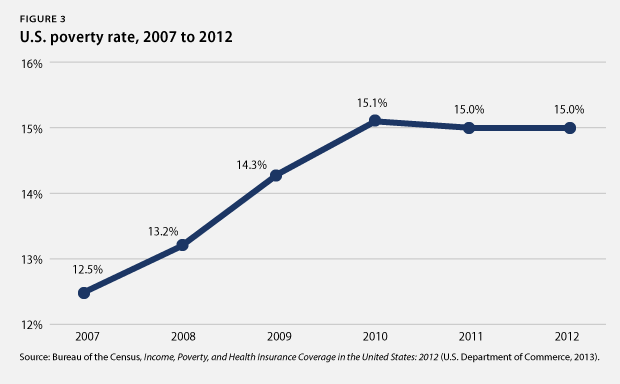
8. The rich continue to pull away from most Americans. Incomes of households in the 95th percentile—those with incomes of $191,000 in 2012, the most recent year for which data are available—were more than nine times the incomes of households in the 20th percentile, whose incomes were $20,599. This is the largest gap between the top 5 percent and the bottom 20 percent of households since the U.S. Census Bureau started keeping records in 1967. Median inflation-adjusted household income stood at $51,017 in 2012, its lowest level in inflation-adjusted dollars since 1995. And the poverty rate remains high—at 15 percent in 2012—as the economic slump continues to take a massive toll on the most vulnerable citizens.
9. Corporate profits stay elevated near pre-crisis peaks. Inflation-adjusted corporate profits were 88 percent larger in December 2013 than in June 2009. The after-tax corporate-profit rate—profits to total assets—stood at 3.2 percent in December 2013, nearing the previous peak after-tax profit rate of 3.3 percent that occurred prior to the Great Recession. Corporate profits recovered quickly during the economic recovery, highlighting the bifurcated nature of the economy.
10. Corporations spend much of their money to keep shareholders happy. From December 2007—when the Great Recession started—to December 2013, nonfinancial corporations spent, on average, 98 percent of their after-tax profits on dividend payouts and share repurchases. In short, almost all of nonfinancial corporate after-tax profits went to keep shareholders happy during the current business cycle. Nonfinancial corporations also held, on average, 5.4 percent of all of their assets in cash—the highest average share since the business cycle that ended in December 1969. Nonfinancial corporations spent, on average, 168 percent of their after-tax profits on capital expenditures or investments—by selling other assets and by borrowing. This was the lowest ratio since the business cycle that ended in 1960. U.S. corporations have prioritized keeping shareholders happy and building up cash over investments in structures and equipment.
11. Poverty is still widespread. The poverty rate remained flat at 15 percent in 2012—the most recent year for which data are available—which is an increase of 0.7 percentage points over the three years of the recovery from 2009 to 2012. The poverty rate has fallen on average by 0.7 percentage points in previous recoveries of at least equal length. Moreover, some population groups suffer from much higher poverty rate than others. The African American poverty rate, for instance, was 27.2 percent and the Hispanic poverty rate was 25.6 percent, while the white poverty rate was 9.7 percent. The poverty rate for children under age 18 stood at 21.8 percent. More than one-third of African American children—37.9 percent—lived in poverty in 2012, compared to 33.8 percent of Hispanic children and 12.3 percent of white children.
12. Household debt is still high. Household debt equaled 103.8 percent of after-tax income in December 2013, down from a peak of 129.7 percent in December 2007. A return to debt growth outpacing income growth, which was the case prior to the start of the Great Recession in 2007, from already-high debt levels could eventually slow economic growth again. This would be especially true if interest rates also rise from historically low levels due to a change in the Federal Reserve’s policies. Consumers would have to pay more for their debt, and they would have less money available for consumption and saving.
Christian E. Weller is a Senior Fellow at the Center for American Progress and a professor in the Department of Public Policy and Public Affairs at the McCormack Graduate School of Policy and Global Studies at the University of Massachusetts, Boston. Sam Ungar is a Research Assistant at the Center.