Authors’ note: CAP uses “Black” and “African American” interchangeably throughout many of our products. We chose to capitalize “Black” in order to reflect that we are discussing a group of people and to be consistent with the capitalization of “African American.”
Tomorrow, the U.S. Bureau of Labor Statistics (BLS) will release its Employment Situation Summary for the month of August. So far this year, the labor market has largely shrugged off economic headwinds that have slowed the economy overall, but this month’s jobs data follow the BLS’ downward revision of half a million to the 2019 jobs numbers earlier this month, indicating the labor market was not as strong as we previously thought.
This past Sunday, President Donald Trump’s 15 percent tariffs went into effect on $112 billion of Chinese goods. These taxed items include a variety household goods such as clothing and back-to-school items that, until now, had not been subject to Trump’s trade war. The Federal Reserve Bank of New York estimates that—even before this recent increase—the tariffs will cost the average American household more than $800 annually, further squeezing workers’ paychecks and threatening the consumer spending that has driven economic growth in 2019. With increasing uncertainty from the Trump administration’s policies, and financial markets signaling that the economic slowdown has elevated concerns about the possibility of recession, August’s jobs data is an especially important real-time indicator to follow when assessing the nation’s economic health.
While some top-line numbers remain relatively strong, other economic indicators spark reason for concern. The Congressional Budget Office expects gross domestic product growth to slow to a rate below its historical average, and wages have remained essentially stagnant for many workers even through the recovery from the recession. Furthermore, the situation for many workers who are often overlooked in broad summary statistics, including older or Black workers, does not align with the top-line numbers. Economists and policymakers should look beyond top-line indicators when evaluating the health of the labor market following this month’s release.
Unemployment
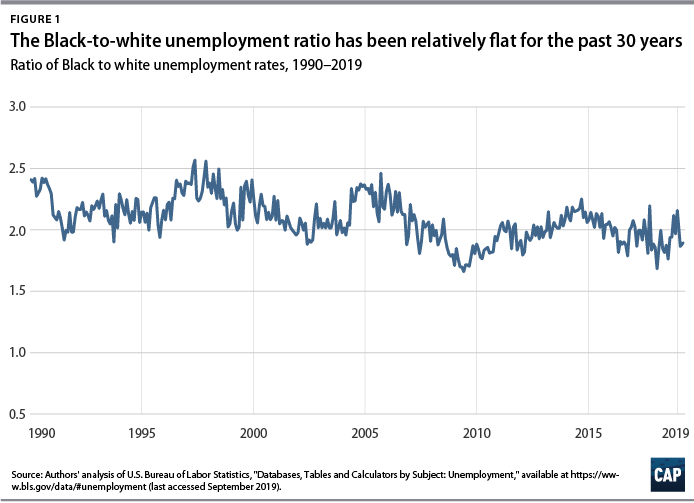
The gains from the economic recovery following the Great Recession have not been experienced equally among different demographics. Groups with historically worse labor market conditions continue to face higher unemployment rates, which lead to long-term detrimental effects, such as lower lifetime earnings and decreased future homeownership rates. The overall unemployment rate fell from 10 percent to 3.7 percent between the peak of the financial crisis, in October 2009, and July 2019, the latest month for which data are available. And while the unemployment rate for Black or African American workers also dropped—from 15.8 percent to 6 percent—during this time frame, there still exists a significant gap in unemployment rates between Black or African American and white people. (see Figure 1)
U-3 vs. U-6
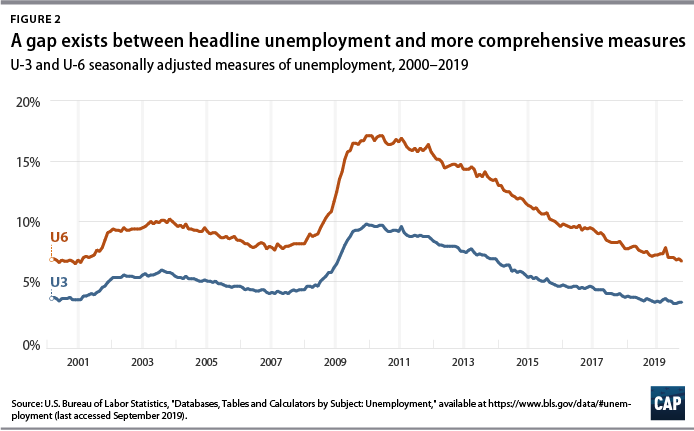
The U-3 unemployment rate, the most common unemployment measure, can underestimate the number of those who are unable to find jobs. For example, it does not capture the people who want jobs but have given up looking for work or the people who would like full-time work but can only find part-time positions. U-6, perhaps the most comprehensive unemployment measure, alleviates this problem by including marginally attached workers—those who have recently looked for work but are not currently looking—and part-time workers who would prefer full-time work. A low U-6 rate indicates that people who face greater barriers in finding employment are being pulled back into the labor market due to greater economic opportunity. U-6 is always higher than U-3, but the gap grew much larger than usual during the recession and has remained higher than or near prerecession records over the course of the recovery.
Job growth by sector
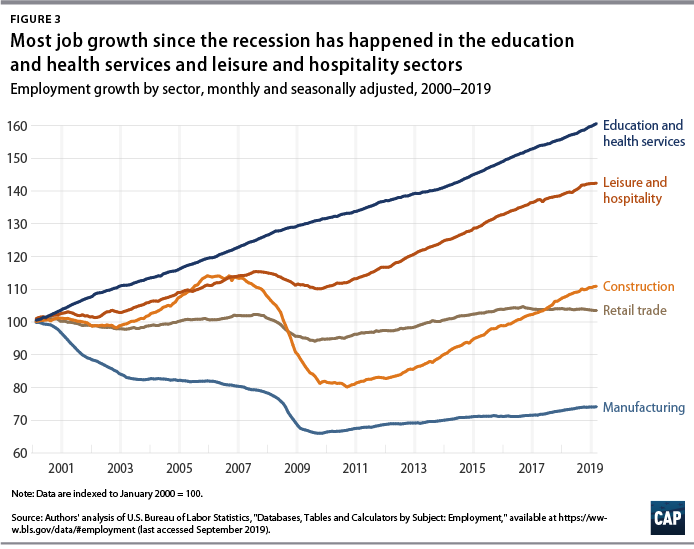
Broader economic trends that put pressure on American workers, in conjunction with the disconcerting priorities of the Trump administration, hurt working families. They also emphasize the need to highlight the true conditions and lived experiences of people across the economy. Job growth has been uneven across all sectors of employment since the Great Recession, with many only now returning to their prerecession employment levels. A closer look at the sectors shows that the education and health, as well as the leisure and hospitality sectors, have seen the most job growth since the recession. (see Figure 3)
Conclusion
Friday’s employment data will provide an updated snapshot of the U.S. economy and labor market performance. Although the headline economic indicators have importance—in particular when there is rising global economic uncertainty—it is also essential to focus on the gaps along the lines of race, age, and gender in order to fully assess the health of the economy and to understand the economic outcomes that exist across different demographic groups. And as economic conditions appear to be weakening, it’s clear that even more work needs to be done to bring individuals back into the labor market. Policymakers and economists need to consider these challenges, as well as populations who face high labor market barriers, when evaluating the health of the labor market and implementing policies that affect it.
Galen Hendricks is a research assistant for Economic Policy at the Center for American Progress. Michael Madowitz is an economist at the Center.