This Friday, the U.S. Bureau of Labor Statistics will release employment data for June, and for the first time in a while, there are real concerns about whether the steady job gains that the United States has seen since 2011 will continue. So far this year, the labor market has mostly shrugged off economic headwinds, but many experts are worried that slowing global growth associated with Trump administration’s trade policies may also slow the U.S. economy. With the Federal Reserve signaling that it expects to cut rates this month—in part due to trade headwinds and in part due to stagnant wages—jobs data will be an important real-time indicator of economic health during a time of unusual uncertainty.
While unemployment remains low after nearly 10 years of recovery following the Great Recession, most workers haven’t felt the benefits of a tight labor market: Higher corporate profits have enriched those at the top, but wages for the working and middle class have mostly remained relatively flat. The Fed should not slow down the labor market to help push down wages; while interest rate hikes remain the main policy tool to slow or halt inflation in an overheating economy, they typically lead to slower economic growth and higher unemployment—and thus are a tool that should be used sparingly. Yet with sluggish wage growth for most of the past 20 years, policymakers need to take steps beyond hoping that a tight labor market will raise wages for everyone.
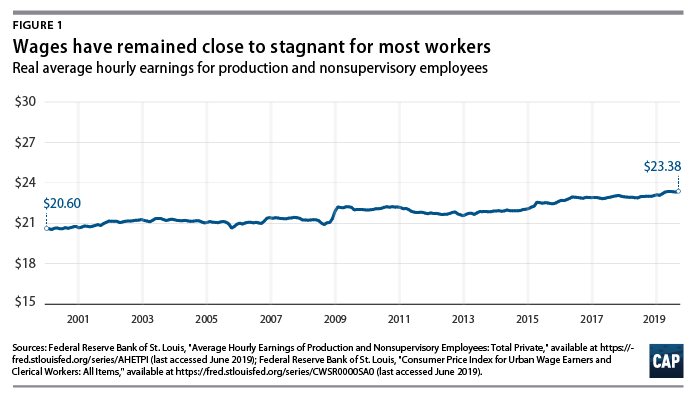
Stagnant pay and the case for increasing the minimum wage
Wages for production and nonsupervisory workers have remained virtually stagnant for decades, increasing just $2.77 since the beginning of 2000. (see Figure 1) All the while, costs of living—including child care and education, just to name a few—have continued to rise, cutting into wage growth for most Americans.
If labor behaved according to the supply and demand curve, then in a market with low unemployment, one would expect the demand for—and therefore the price of—labor to rise. Yet while the United States has continued to see healthy job growth for roughly a decade, this job growth has not been accompanied by wage growth. Part of this can be explained by a deep recession and the relatively rapid growth in the labor force that soon followed; there are 9.5 million more Americans in the labor force today than there were at the low point of the recession. Moreover, among Americans 65 and older, the labor force has increased by 65 percent over the past decade, with 4 million more Americans in this age group working or looking for work than there were a decade ago.
Given that historically low unemployment does not raise wages beyond a level that leaves families in poverty, policymakers should consider other ways to sustainably grow the economy.
What little wage growth has occurred recently is due in significant part to state- and city-level laws to raise the minimum wage, rather than demand pressure. Recent research from the Economic Policy Institute demonstrates that since 2013, wage growth for the bottom 10th percentile of earners occurred 50 percent faster in states that raised their minimum wage than in states that did not. In other words, wage growth is attributable to policy changes, not the theoretically inevitable implications of a tight labor market.
However, depending on cities and states to one by one raise their minimum wage is impractical; states with conservative legislatures have not only struck down proposals to increase their statewide minimum wage, but have also constrained the ability of cities and counties to decide to increase their own minimum wage levels. For example, in 2016, Birmingham, Alabama’s city council voted to raise the city’s minimum wage to $10.10 per hour. In response, the Alabama Legislature voted to preempt the ability of localities to set their own minimum wage, voiding the Birmingham law and preventing other cities or counties from raising wages. Alabama does not have its own state minimum wage, so employers follow the federal minimum of $7.25. At $7.25 per hour, Birmingham residents would have to work 81 hours each week to afford a market-rate, one-bedroom rental apartment.
The federal minimum wage last rose between 2007 and 2009, when it was gradually increased from $5.15 per hour to $7.25 per hour. However, since 2009, $7.25 has lost significant purchasing power. Late June 2019 marks the longest period between federal minimum wage increases since the minimum wage was created in 1938.
Unemployment
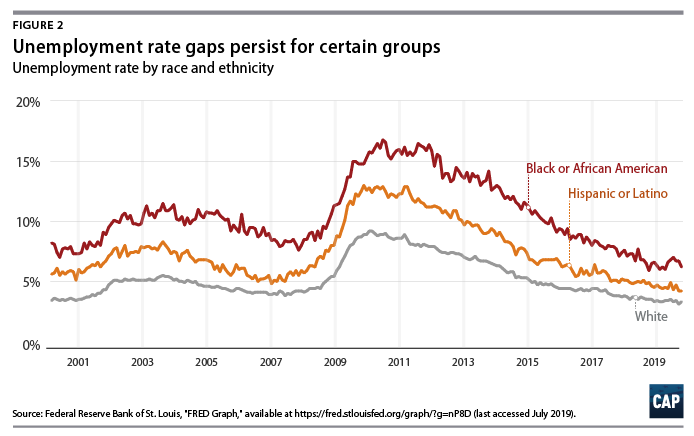
The gains from the economic recovery have not been experienced equally among different demographics. Groups with historically worse labor market conditions continue to face higher unemployment rates, which lead to long-term detrimental effects, such as lower lifetime earnings and future homeownership rates. The overall unemployment rate fell from 10 percent to 3.6 percent between the peak of the financial crisis in October 2009 and May 2019, the latest month for which data are available. And while the unemployment rate for black or African Americans also dropped—from 15.8 percent to 6.2 percent—during this time frame, there still exists a significant gap in unemployment rates between black or African Americans and white people. Furthermore, younger people face disproportionately high unemployment rates, with black or African American youth from 16 to 19 years old experiencing unemployment rates that are more than six times that of the overall population and more than twice that of their white counterparts.
According to the latest data available, the black or African American unemployment rate remains almost double the unemployment rate for whites—7 percent versus 3.3 percent, respectively. For Hispanic or Latino people, the gap is smaller but persists. (see Figure 2)
Conclusion
Friday’s employment data will provide an updated snapshot of the U.S. economy and labor market performance and, hopefully, some relief after recent economic news has increased anxieties. Although the headline economic indicators are important, in order to fully assess the health of the economy, it is essential to focus on unemployment gaps as well as long-term earnings trends. It is crucial to understand the economic outcomes that exist across different sectors and different demographic groups. Top-line job numbers do not indicate whether workers are paid a wage that allows them to move out of poverty, and policymakers who focus on jobs instead of wages, income, and wealth ignore how most workers and families experience the economy.
Lily Roberts is the director of Economic Mobility at the Center for American Progress. Daniella Zessoules is a special assistant for Economic Policy at the Center. Galen Hendricks is a special assistants for Economic Policy at the Center. Michael Madowitz is an economist at the Center.