With the 10-year anniversary of the economic recovery this month, policymakers may be easily lulled into complacency when it comes to employment—but they would be remiss to do so. The jobs market has been resilient in the face of several counterproductive policies over the past two years—from the Tax Cuts and Jobs Act to the Trump administration’s escalating trade war—and it’s difficult to overstate how important strong job growth remains to the most vulnerable Americans. Not only do African Americans and Latinx Americans face significant employment gaps, but the fact that minorities are last hired and first fired also means that strong job growth is especially important to these workers long after the official end of a recession. If anything can be learned about the U.S. labor market over the past decade, it is that policymakers have underestimated the benefits of an extended recovery and in particular how it affects the most vulnerable Americans. Challenges also remain for workers living in rural communities, workers with disabilities, and workers looking for a raise.
The U.S. Bureau of Labor Statistics (BLS) will release its monthly report with May’s jobs numbers on Friday, and all indications are that the steady job gains that the United States has seen since 2011 will continue for yet another month.
Stagnant wages, sectoral employment, and the need for economic security
Forty percent of Americans are unable to cover a $400 emergency expense, and wages have remained close to stagnant for most people, despite gains for top earners. An analysis from the Economic Policy Institute shows that labor income for the bottom 90 percent of Americans has shrunk by more than 10 percent since 1979—translating to about $10,800 of total lost wages per household. All the while, costs of living—including child care and education costs—have continued to rise, outpacing wage growth for most Americans. With little sign of bipartisan cooperation on pro-worker policies, a tight labor market is the primary area in which most workers can expect to reverse this trend in the coming year.
Broader economic trends that put pressure on American workers—in conjunction with the Trump administration’s disconcerting priorities that favor the wealthy and corporations—hurt working families. They also put into focus the need to highlight the conditions and lived experiences of people across the economy. Job growth has been uneven across all sectors of employment since the Great Recession, with many sectors only now returning to their prerecession employment levels. The food service and health care sectors—which tend to have lower-than-average hourly earnings—have seen the most job growth since the recession.
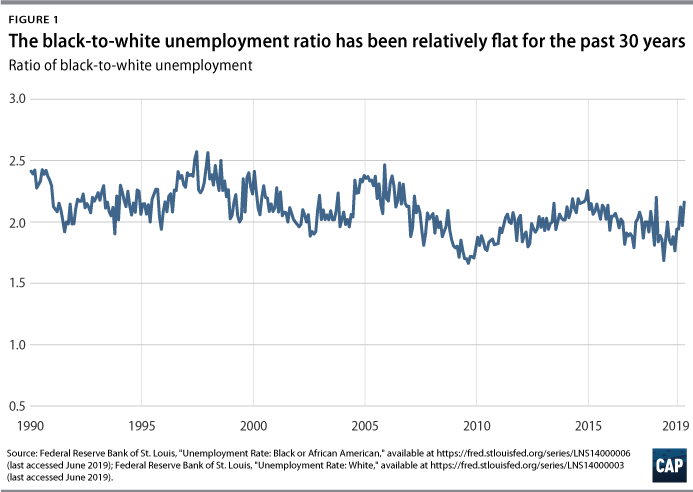
The black-to-white unemployment ratio
Persistent wealth and income gaps as well as the housing affordability crisis prevent many groups from accessing the resources they need to thrive in the U.S. economy. Economic realities—including the changing demographics of the labor force in terms of both age and race and ethnicity as well as occupational differences compared with decades prior—highlight the need to explore the nuances of broad economic indicators.
The gains from the economic recovery have not been experienced equally among different demographics, and groups with historically worse labor market conditions continue to face higher unemployment rates, which lead to long-term detrimental effects such as lower lifetime earnings and future homeownership rates. The overall unemployment rate fell from 10 percent to 3.6 percent between the peak of the crisis in October 2009 and April 2019, the latest month for which data are available. While the unemployment rate for blacks or African Americans dropped from 15.8 percent to 6.7 percent during the same time frame, there is still a significant gap in unemployment along the lines of race. Younger people also face disproportionately high unemployment rates, with black or African American youth suffering from unemployment rates that are more than four times that of the overall population.
The gap in unemployment rates for black or African Americans and white Americans is a persistent feature of a labor market that has changed significantly since the BLS began reporting monthly unemployment rates by race almost 50 years ago. As seen in Figure 1, the overall black-to-white unemployment ratio has remained relatively flat for the past 30 years.
Recessions don’t hit all groups equally
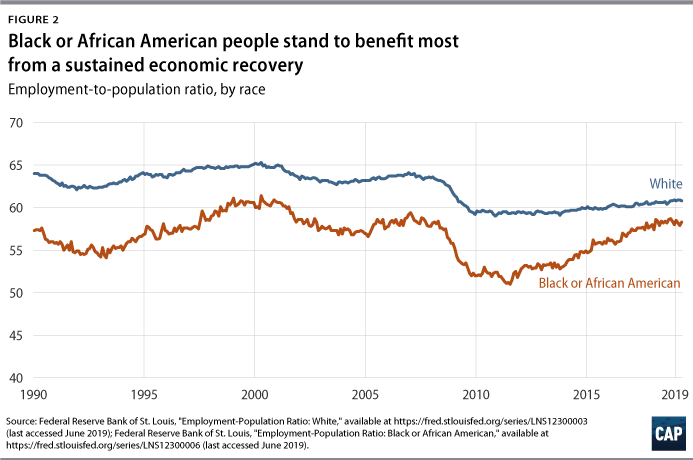
In the aftermath of the Great Recession, black unemployment hit 16 percent while white unemployment reached about 9 percent. That black or African Americans are roughly twice as likely as white Americans to be unemployed even through a recession is a clear indicator that black or African American workers experience a disproportionate share of job losses. And the unemployment rate understates this effect. As seen in Figure 2, the employment-to-population ratio, or the share of those employed of the working population, fell much more sharply during the recession for black or African American people than for white people. It has also continued to increase long into the recovery and well after the ratio stabilized for white workers, illustrating how important continued progress in the labor market is when analyzed just slightly beyond the surface of economic data.
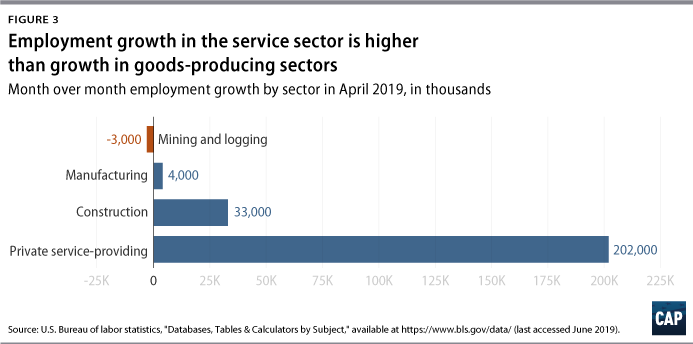
While employment in the service sector continues to expand, manufacturing and mining inch upward
President Donald Trump has promised to bring back coal and manufacturing jobs to U.S. workers; however, these sectors have played a diminished role in the economy since 1980—especially in recent years. Since its peak in July 1979, goods-producing employment—the top-line category that includes construction, mining, manufacturing, and others—has decreased by 16 percent and remains more than 4 million jobs below its 1979 level. Service employment, on the other hand, has grown by 100 percent since 1979 and from less than three times larger than goods-producing employment to more than six times larger today. As shown in Figure 3, service employment levels are much higher than goods-producing levels, meaning a percentage increase in service employment has a much larger effect on overall employment levels.
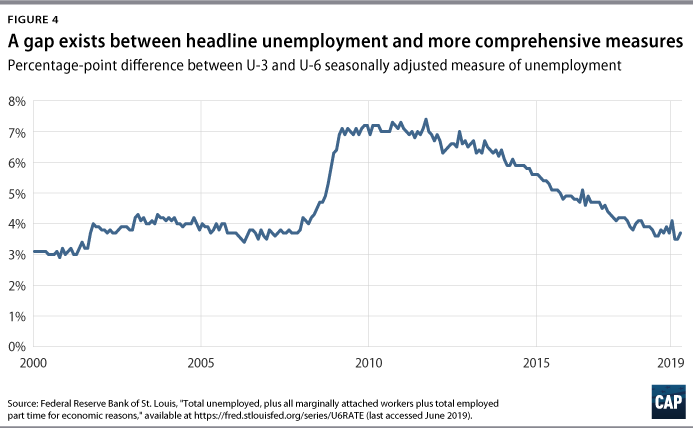
U-3 vs. U-6
The U-3 unemployment rate, the most common unemployment measure, can underestimate those who are unable to find jobs. For example, it does not capture the people who want jobs but have given up looking for work or the people who would like full-time work but can only find part-time positions. Perhaps the most comprehensive unemployment measure, U-6 alleviates this problem by including marginally attached workers—those who have recently looked for work but are not currently looking—and part-time workers who would prefer full-time work. A low U-6 indicates that people who face greater barriers in finding employment are being pulled back into the labor market due to greater economic opportunity. U-6 is always higher than U-3, but the gap grew much larger than usual during the recession and has remained above or near prerecession records over the course of the recovery.
Conclusion
Despite overall low unemployment rates and a welcomed continuation of normal growth in gross domestic product, the reality behind wages—as well as the disproportionate hurdles that certain groups face in the labor market—suggest that workers may not be seeing the gains and opportunities of an economy that appears healthy from the headlines. There is still room for the economy to grow—and when considering economic priorities, it is essential that analysts and policymakers take a variety of indicators into account instead of overstating the economic prosperity of the past few years.
Galen Hendricks and Daniella Zessoules are special assistants for Economic Policy at the Center for American Progress. Michael Madowitz is an economist at the Center.