This column contains a correction.
This Friday, the U.S. Bureau of Labor Statistics (BLS) will release employment data for January—the first release of 2019—marking two years since President Donald Trump took office. The data will be released just after the end of the longest government shutdown in U.S. history.
The shutdown meant that approximately 800,000 federal employees and up to 1.2 million more federal contractors and support staff were either furloughed or working without pay—this may affect January’s jobs day data. In figures from the BLS household survey, such as unemployment, all government workers who worked without pay are classified as employed, while those not working are all classified as unemployed. Furloughed government contractors who do not receive back pay should be classified like any worker who was laid off in both the household survey and the payroll survey, though there likely will be a bit of misreporting this month. Furloughed government workers do not affect any statistics, such as number of jobs added, from the payroll survey. The Congressional Budget Office estimates that the shutdown will have an $11 billion temporary hit as well as a $3 billion permanent hit on gross domestic product (GDP). Moreover, reliable data sources such as the U.S. Bureau of Economic Analysis’ GDP forecasts, as well as census data—including Current Population Survey microdata—were delayed as well. This will affect researchers across the country who use these data to provide analysis so that businesses, households, and policymakers can make more-informed economic choices.
The economy has begun to recover from the recession, but persistent gaps remain
Over the past 10 years, the economy has finally begun to recover from the devastating financial crisis, thanks to the fiscal stimulus and financial stabilization policies enacted by the Obama administration in response. Looking ahead to the rest of 2019, however, it is important to gauge the economy beyond top-line figures to accurately assess wider aspects of economic health and to center economic well-being and mobility for groups who face disproportionate labor market barriers.
Persistent wealth and income gaps, as well as the housing affordability crisis, prevent many groups from accessing the resources they need to thrive in the U.S. economy. Economic realities—including the changing demographics of the labor force, in terms of both age and race and ethnicity, as well as occupational differences compared with decades prior—highlight the need to explore the nuances of broad economic indicators. Yet despite inheriting an economy that is finally beginning to recuperate, President Trump continues to tout his economic successes for American workers on the back of an “explosive Stock Market” and recent tax cuts. Reality paints a different picture.
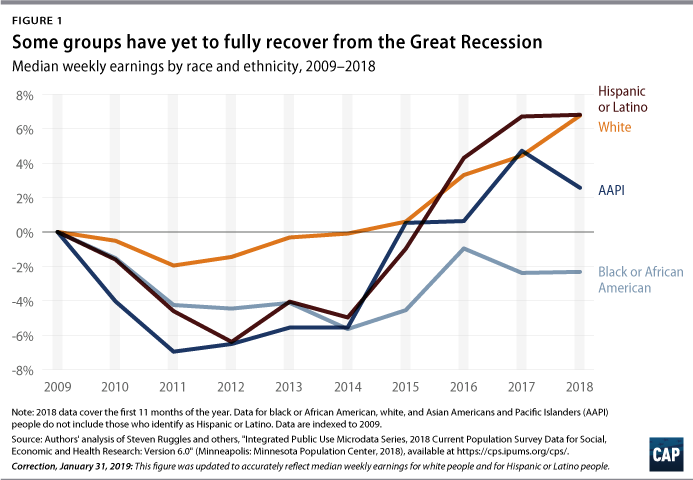
Median earnings
As seen in Figure 1, the Great Recession disproportionately affected people of color. When compared with their white counterparts, Hispanic or Latino, Asian American and Pacific Islander, and black or African Americans took years longer to recover their lost earnings. In fact, black or African American median weekly earnings have yet to fully recover since 2009—meaning that this group is making 2 percent less than what it made in 2009. However, the continual economic impact of the recession spans much further than earnings; wealth inequality has widened along racial and ethnic lines since the end of the Great Recession. Latinx families hold just one-sixth of the wealth of whites, and black or African Americans own less than one-tenth of white Americans’ wealth at the median. Persisting wealth and income gaps, coupled with a lagging recovery from the recession, emphasize the need to assess the nuances under aggregate summary statistics.
Unemployment
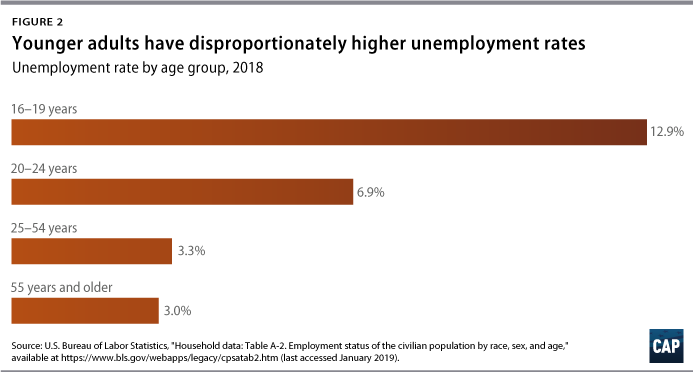
While other groups have slowly returned to work since the Great Recession, the data for younger Americans, particularly those ages 16 to 24, paint a starker picture. In 2018, teenagers faced an unemployment rate of nearly 13 percent, while young adults ages 20 to 24 faced a rate of almost 7 percent. Both numbers are much higher than the overall unemployment rate of 3.9 percent. Other factors also spark reason for concern for the younger generations. Though more youth are pursuing higher education, giving them a leg up in the labor market, the cost of education has skyrocketed. And despite being the most educated compared with previous generations, this group has not necessarily seen higher earnings over time. One in 5 American adults ages 18 to 34 has student loan debt, which can have devastating effects on future economic security.
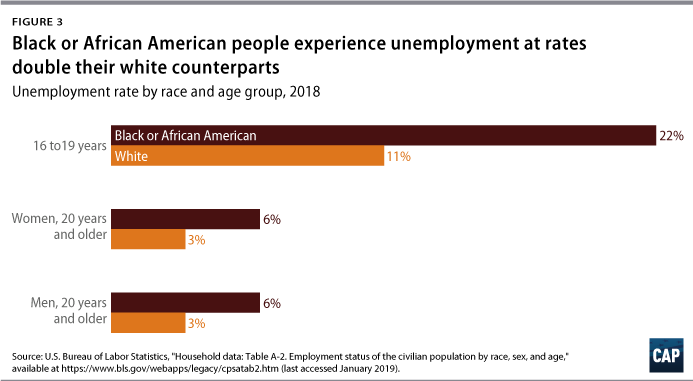
A closer look at unemployment rates by race and age shows the disproportionate burden for blacks or African Americans compared with their white counterparts. In 2018, more than 1 in 5 black teenagers were unemployed, a rate almost double that of their white counterparts. (see Figure 3)
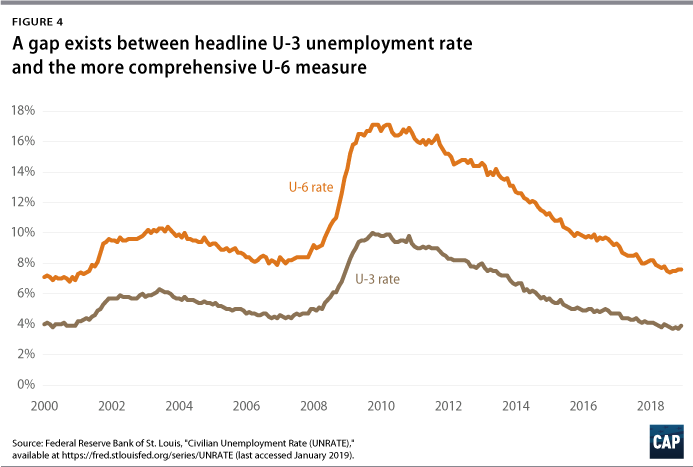
The headline unemployment rate, otherwise known as U-3, is the most frequently cited indicator of labor market health, but it can underestimate the number of those who are unable to find jobs. For example, it does not capture the people who want jobs but have given up looking for work or those who would like full-time work but can only find part-time positions. U-6, perhaps the most comprehensive unemployment measure, alleviates this problem by including marginally attached workers—those who have recently looked for work but are not currently looking—and part-time workers who would prefer full-time work. A low U-6 indicates that people who face greater barriers to finding employment are being pulled back into the labor market due to greater economic opportunity. U-6 is always higher than U-3, but the gap grew much larger than usual during the recession and has remained above or near pre-recession levels over the course of the recovery. (see Figure 4)
Each of the indicators discussed above provides important context on the health of the labor market and should be repeatedly considered in evaluating the 2019 economy. These factors—in addition to differentiating employment and earnings by age, region, and race—can guide policymakers’ understanding of how much and where the economy can grow, balanced against inflationary pressure in a tight labor market.
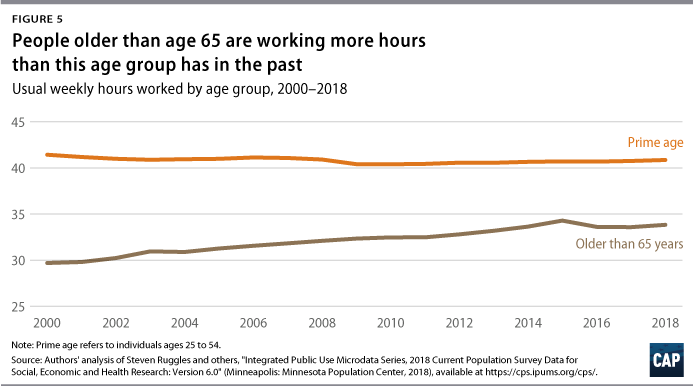
Usual hours worked
It is also important to pay attention to job growth since 2000 among older workers. Not only has this segment of the population been fast-growing, but employment growth among this group has been rapid as well. In a backward-looking narrative, this group is less informative, because rising employment among older workers is neither unambiguously good or bad news. But from a forward-looking point of view, this is an increasingly important part of the labor market; the share of workers older than age 55 has almost doubled since the mid-1990s.
A similar trend exists in hours worked per week among workers. Prime-age workers, those ages 25 to 54, are still below their 2000 levels in both employment and usual hours worked per week—an issue that receives a good deal of attention. But as policymakers seek to better understand why inflation and wage growth have remained subdued—even as prominent labor market indicators have signaled the tight job market that historically has produced acceleration in both trends—large changes in employment and hours among older workers are key to understanding the 2019 labor market.
Conclusion
Friday’s employment data will provide an updated snapshot of the U.S. economy and labor market performance. Although the headline economic indicators have importance, it is essential to focus on the unemployment and earnings gaps along the lines of race, age, and gender to fully assess the health of the economy. It is important to understand the economic outcomes that exist across both different ages and demographic groups. Although the economy is doing well in the aggregate, more work needs to be done to bring individuals back into the labor market. Policymakers and economists need to make sure to consider these challenges, as well as populations who face high labor market barriers, when evaluating the health of the labor market and implementing policies that affect it.
Daniella Zessoules is a special assistant for Economic Policy at the Center for American Progress. Galen Hendricks is a special assistant for Economic Policy at the Center. Michael Madowitz is an economist at the Center. Olugbenga Ajilore is a senior economist at the Center.