This column contains corrections.
Though the number of unemployed youth has inched down to below prerecession rates, many other indicators suggest that the employment situation for American youth is not so rosy. Though they’re the most educated compared with previous generations, 1 in 5 American adults ages 18 through 34 has student loan debt. Furthermore, many of these folks are defaulting—and across race and ethnicity lines, black or African American and Hispanic or Latino people are disproportionately more likely to default on their loans. Though more youth are educated and pursuing higher education, giving them a leg up in the labor market, the cost of education has skyrocketed: Textbooks, for example, are about 90 times more expensive than they were in 2006.
In 2013, Millennials made 43 percent less than what Gen Xers made in 1995—when they were the same age—suggesting that labor market conditions still have some slack, despite low unemployment and gross domestic product growth.* For those who aren’t college-educated, the situation worsens. According to a Pew Research Center study, the earnings disparity is rising among young adults based on their level of educational attainment—specifically, between high school graduates who attend institutions of higher education and those who do not. The study finds that noncollege-educated high school graduates make less than they have in the past: This age group today makes about 15 percent less than early Baby Boomers made. It also finds that the poverty rate for high school graduates was more than three times the rate for those with a bachelor’s degree.
According to the latest Summer Employment and Unemployment Among Youth survey release, unemployment among youth rose by 567,000 from April to July 2018 compared with an increase of 458,000 for the same period in 2017. Furthermore, the release shows that the youth unemployment rate varies dramatically by race and ethnicity. Black youth have an unemployment rate of 16.5 percent compared with the national youth unemployment rate of 9.2 percent. Asian and Hispanic youth had 8.4 percent and 10 percent unemployment rates, respectively.
Tomorrow, the U.S. Bureau of Labor Statistics (BLS) will release its Employment Situation Summary for the month of September. Since postrecession employment recovery began in February 2010, the U.S. economy has added more than 19 million jobs, and the steady tightening of the labor market has finally started to deliver some modest wage growth for workers. Unfortunately, President Donald Trump has not furthered this economic progress; he has neglected to push for any economic policies that would help workers or create jobs. Economists and policymakers should take this into account when evaluating the health of the labor market after the BLS releases its monthly employment numbers. In particular, this lack of progress underscores the importance of considering the most disadvantaged members of the population—including youth and, in particular, youth of color—in addition to the overall numbers.
Last month, the unemployment rate for blacks or African Americans was 6.3 percentage points, more than 2 percentage points higher than the overall unemployment rate. According to the BLS, the unemployment rate for black or African American youth ages 16 through 24 remains three times higher than the overall unemployment rate, at 12.1 percent. This means that slightly more than 1 in 8 black youth who are actively looking for a job are unable to find one—not to mention the exasperation of the stark labor market situation facing black and African American people when looking across the lines of both race and gender. Some measures may indicate that the unemployment rate is at historic lows; however, the gap in unemployment along the lines of race and sex has persisted, bringing to light the inadequacies with this administration’s deficient claims.
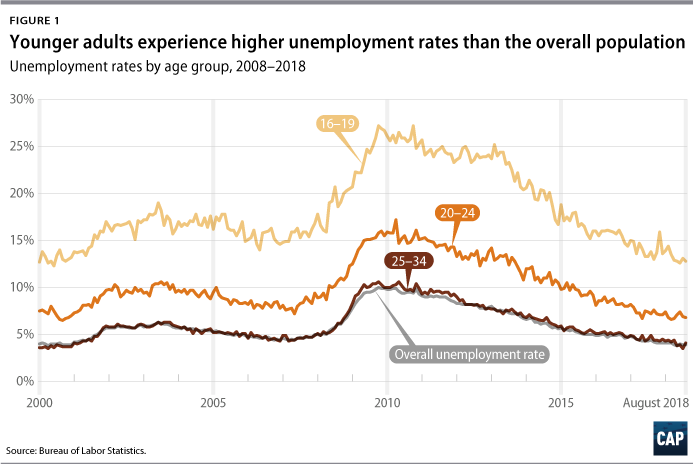
The gap between overall unemployment and youth unemployment remains—and is even worse for younger cohorts
Youth unemployment for each age cohort has continued its steady decline since the peak of the recession but has stayed well above the unemployment rate for the labor force as a whole. In particular, youth ages 16 through 19 continue to suffer from an unemployment rate more than three times higher than the general unemployment rate, while those ages 20 through 24 are experiencing a rate of unemployment that is nearly twice as high. (see Figure 1) These numbers represent a loss of opportunities for youth to gain skills and experience at a crucial early stage of their working live. As a previous CAP analysis has found, this loss can also lead to significantly lower lifetime earnings.
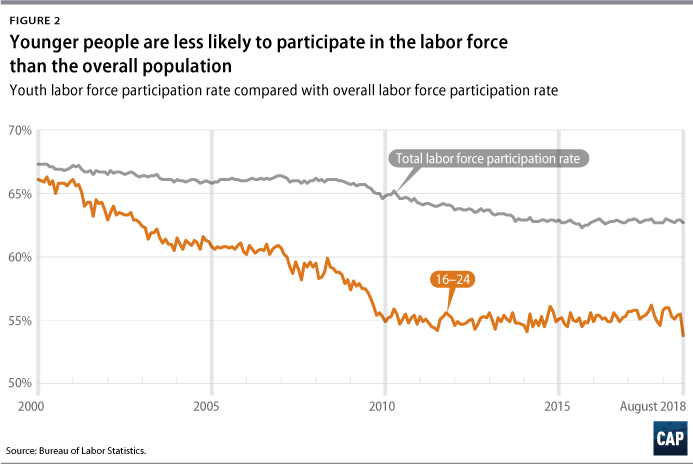
Labor force participation rates among youths
Labor force participation rates for youth age 16-24 have continued to inch downward, with August numbers decreasing 1.7 percentage points. Though the trend in youth labor force participation stems from the increase in higher education attendance rates, it is important to note that the labor force participation rate has declined at an even steeper rate for those with no high school diploma.
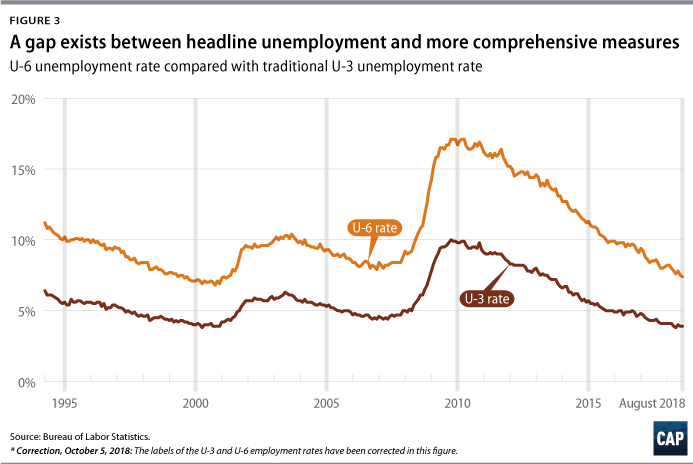
U-3 vs. U-6
The U-3 unemployment rate, the official and most commonly cited unemployment measure, can underestimate the number of people who are unable to find jobs. For example, it does not capture those who want jobs but are not currently looking for work or the people who would like full-time work but can only find part-time positions. U-6, on the other hand, perhaps the most comprehensive unemployment measure, alleviates this problem by including marginally attached workers—those who have recently looked for work but are not currently looking—and part-time workers who would prefer full-time work. A low U-6 rate indicates that people who face greater barriers in finding employment are being pulled back into the labor market due to greater economic opportunity. U-6 is always higher than U-3, but the gap between the two rates grew much larger than usual during the Great Recession and has remained above or near prerecession records over the course of the recovery. (see Figure 3)
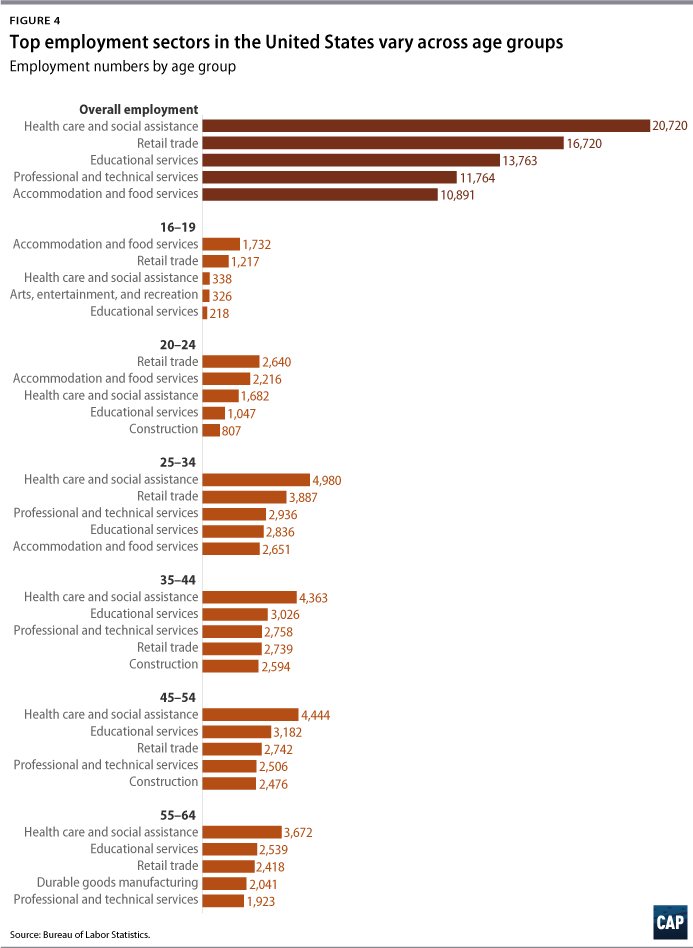
Most youth work in leisure and hospitality services, though it varies by age
A majority of youth ages 16 through 19 work in leisure and hospitality services. For those ages 20 through 24, most work in wholesale and retail trade as well as in education and health services. Overall, an overwhelming majority of all workers work in education and health services, followed by health care, social assistance, and wholesale and retail trade, most closely matching with the most popular sectors for those ages 20 through 24.
Notably, food services and drinking places dominate overall employment in leisure and hospitality, an industry with some of the lowest rates of unionization. Furthermore, studies have shown that sexual harassment is particularly pervasive in the service and hospitality sectors, especially in the restaurant industry.
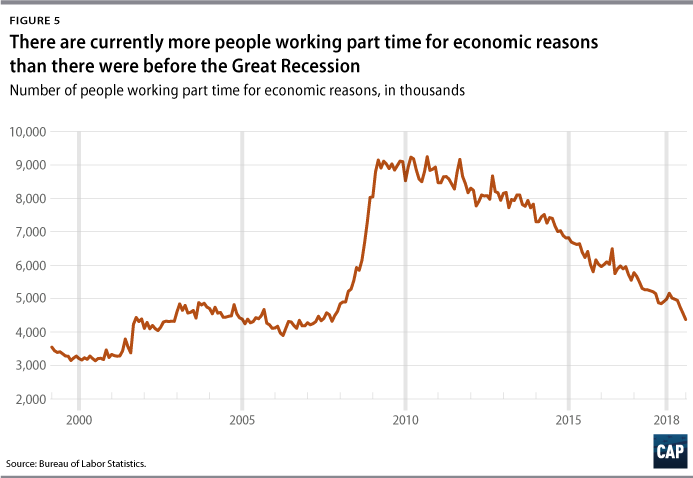
The number of people working part time for economic reasons remains very high
The number of workers who are employed part time for economic reasons remains high compared with prerecession levels. This high number of involuntary part-time workers—those who are part-time because their hours are cut or because they cannot find a full-time job—indicates a labor market that is less favorable for all workers. In August 2018, the number was about 4.4 million, which is still significantly higher than the 1999 low of slightly more than 3 million.
Conclusion
Friday’s employment data will provide an updated snapshot of the U.S. economy and labor market performance. Although the headline unemployment rate, U-3, is an important indicator, the U-6 measure, in addition to focusing on the unemployment gaps along the lines of race, age, and gender, may serve as a more effective marker of the health of the economy. It is important to understand the economic outcomes that exist across different ages and across demographic groups. Although the economy is doing well in the aggregate, more work needs to be done to bring individuals back into the labor market. In order to maintain economic growth, this administration must take these data into serious consideration in its decision-making.
Daniella Zessoules is a special assistant for Economic Policy at the Center for American Progress. Nicholas Eckart is an intern at the Center. Galen Hendricks is a special assistant for Economic Policy at the Center. Michael Madowitz is an economist at the Center.
*Correction, July 17, 2019: This column has been updated to clarify how much Millennials were making in 2013 compared with what Gen Xers made at that same age in 1995.