On Friday, the U.S. Bureau of Labor Statistics (BLS) will release its Employment Situation Summary for the month of August. Despite claims from the Trump administration that the average family would see $4,000 annual pay raises, wages have remained stagnant throughout Trump’s presidency so far. Yet, corporate profits continue to soar, with little evidence that the administration’s promise is panning out for workers.
In light of the start of a new school year, this column highlights the state of the U.S. labor market for teachers. Just last week, thousands of teachers in Washington state went on strike, echoing concerns expressed throughout the past year from states all over the county with a common central problem: low pay. This is unsurprising, given that the average starting base salary is just $41,600 for public school teachers—the lowest relative earnings among all Organization for Economic Co-operation and Development (OECD) member countries. However, the issues underlying the strikes span far beyond teachers’ salaries. Teachers pay out of pocket to provide basic resources for their students and face a labor shortage linked to overall poor working conditions. Despite this, teachers across the country have taken to the streets, the media, and Capitol Hill in order to advocate not just for themselves, but also for an adequately funded education system that can successfully and equitably educate those who need it most.
Despite progress in the touted unemployment numbers, President Trump has failed to support this progress with coherent economic policies that would help workers, raise wages, or create jobs. Instead, his administration and members of the congressional majority have consistently pushed for policies that weaken the programs that help families afford the basics, exacerbate income inequality, and cut back on job-creating public investment.
This column presents labor market indicators to watch in evaluating both the health of the U.S. economy and the effects of the Trump administration and congressional Republicans’ policy priorities. Although the headline unemployment rate—otherwise known as U-3—is the most frequently cited indicator of labor market health, other factors can provide a more complete picture of how the economy is performing and whether lower unemployment is translating into wage gains for all workers. The employment rate, the number of people working part time for economic reasons, and the U-6 unemployment rate—all discussed below—are some of these factors. Additionally, it is important to note how each labor market indicator differs across demographics—for example, by race. Although the national unemployment rate may be low, this indicator can tell a different story for other demographic groups.
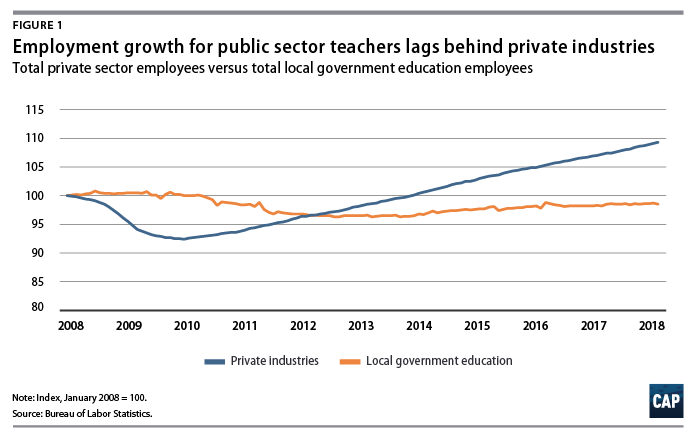
Employment growth for public sector educators lags far behind growth in private industries
Since the employment recovery began in February 2010, the U.S. economy has added more than 19 million jobs, which would typically put positive upward pressure on wage growth. However, local government education wages have seen no such increase. Though local education employment has almost reached prerecession levels, it falls strikingly behind private sector employment growth.
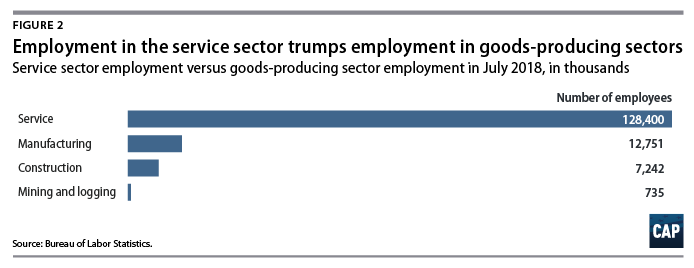
While employment in the service sector continues to expand, manufacturing and mining inch upward
President Trump has promised to bring back coal and manufacturing jobs to U.S. workers; however, these sectors have played a diminished role in the economy since 1980—especially in recent years. Since its peak in July 1979, goods-producing employment—the top-line category that includes construction, mining, manufacturing, and others—has decreased nearly 18 percent and remains nearly 4.5 million jobs below its 1979 level. Service employment, on the other hand, has grown by 104 percent since 1979 and from less than three times larger than goods-producing employment to more than six times larger today. As shown in Figure 2, service employment levels are much higher than goods-producing levels, meaning a percentage increase in service employment has a much larger effect on overall employment levels.
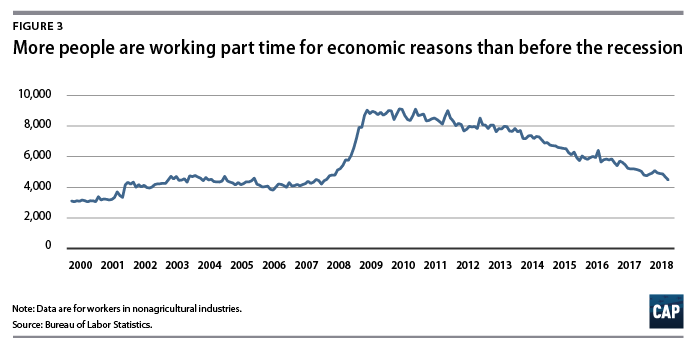
The number of people working only part time for economic reasons remains very high
The number of workers who are employed only part time for economic reasons—meaning that they are unable to find full-time work despite wanting it—remains high compared with prerecession levels. If workers are part-time because their hours are cut or because they cannot find a full-time job, that indicates a labor market that is less favorable for all workers. In July 2018, the number of involuntary part-time workers fell slightly to 4.5 million, but this is still significantly higher than the precrisis low of 3.8 million in April 2006.
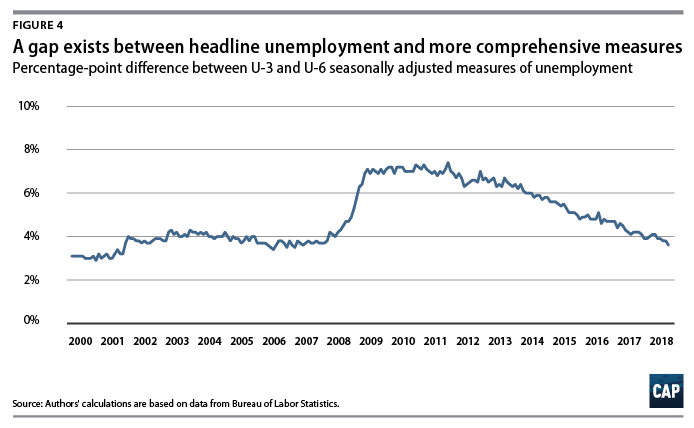
U-3 vs. U-6
The U-3 unemployment rate, the most common unemployment measure, can underestimate those who are unable to find jobs. For example, it does not capture the people who want jobs but have given up looking for work or the people who would like full-time work but can only find part-time positions. Perhaps the most comprehensive unemployment measure, U-6 alleviates this problem by including marginally attached workers—those who have recently looked for work but are not currently looking—and part-time workers who would prefer full-time work. A low U-6 indicates that people who face greater barriers in finding employment are being pulled back into the labor market due to greater economic opportunity. U-6 is always higher than U-3, but the gap grew much larger than usual during the recession and has remained above or near prerecession records over the course of the recovery.
Conclusion
This employment release will provide an updated snapshot of the real economy under the Trump administration. Since the administration has not created any progress on employment-related policies during its first year, it is unlikely that the August data will show any drastic changes. However, as President Trump continues his second year, the indicators highlighted above will be key in evaluating his policies. In order to maintain economic growth, the new administration must take these data seriously in its decision-making. Indicators such as the U-6 unemployment rate show that there is still room to grow to meet previous eras of a strong labor market.
There is still room for the economy to grow, but it will require proactive labor market policy based on good data in order to improve the conditions that American workers face. The importance of sound economic data to guide and evaluate policy decisions cannot be understated. President Trump should embrace such data, such as the monthly jobs report, in the coming months and years to help shape his policy proposals.
Galen Hendricks is a special assistant for Economic Policy at the Center for American Progress. Daniella Zessoules is a special assistant for Economic Policy at the Center. Michael Madowitz is an economist at the Center.