On Friday, the U.S. Bureau of Labor Statistics (BLS) will release its Employment Situation Summary for the month of April. Since the employment recovery began in February 2010, the U.S. economy has added more than 18 million jobs, and the steady tightening of the labor market has finally started to deliver some small but modest wage growth for workers, with wages increasing 2.4 percent over the past year. Unfortunately, President Donald Trump has failed to support this progress with coherent economic policies that would help workers or create jobs. Instead, his administration and members of the congressional majority have consistently pushed for policies that weaken the programs that help families afford the basics, exacerbate income inequality, and cut back on job-creating public investment.
This month, the House of Representatives is expected to debate a highly partisan draft of the 2018 Farm Bill, written without Democratic buy-in by House Agriculture Committee Chairman Conaway. The bill includes policy changes that would deeply cut benefits under the nation’s largest food assistance program, the Supplemental Nutrition Assistance Program (SNAP). More than $8 out of every $10 in SNAP benefits go to households with children, people with disabilities, and seniors. But the program is also critically important for working families who struggle to put food on the table when wages aren’t enough to make ends meet.
The proposed changes, which would reduce or eliminate benefits for more than 2 million people, include harsher work requirements for so-called able-bodied adults as well as benefit cuts for families facing high energy costs and counterproductive asset limits that prevent families from saving. Research has shown that work requirements result in little to no increase in employment or earnings, and enacting these requirements would simply put further stress and punitive time limits on unemployed and underemployed workers. But expanding work requirements isn’t just cruel and ineffective, it’s also based on a fundamental misunderstanding of how the economy works. The millions of working families who must turn to SNAP to help close the gap left by low pay and poor-quality jobs are a clear indicator that policymakers’ choices have failed to deliver an economy that creates the labor demand and bargaining power that workers need to lift wages. Even by the zombie theoretical claim that work requirements would increase employment, they would only do so by increasing labor supply, not demand, putting downward pressure on wages for all workers. The farm bill is a tell that lawmakers don’t just want to make life harder for the Americans who have it the hardest, but that they want to further stack the deck against all workers. And this policy failure falls especially heavily on individuals who face discrimination or barriers to work, such as caretaking obligations, a disability, or a criminal record—and the severe proposed changes to SNAP would compound the challenges they face.
This column presents labor market indicators to watch in evaluating both the health of the U.S. economy and the effects of the Trump administration and congressional Republicans’ policy priorities. Although the headline unemployment rate—otherwise known as U-3—is the most frequently cited indicator of labor market health, other factors can provide a more complete picture of how the economy is performing and whether lower unemployment is translating into wage gains for all workers. The employment rate, the number of people working part time for economic reasons, and the U-6 unemployment rate—all discussed below—are some of these factors. Additionally, it is important to note how each labor market indicator differs across demographics—for example, by race. Although the national unemployment rate may be low, this indicator can tell a different story for other demographic groups.
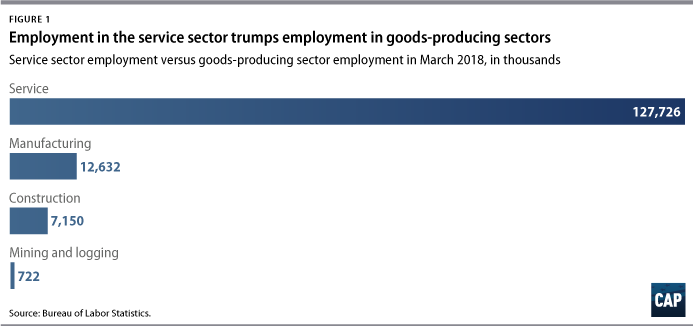
While employment in the service sector continues to expand, manufacturing and mining inch upward
President Trump has promised to bring back coal and manufacturing jobs to U.S. workers; however, these sectors have played a diminished role in the economy since 1980—especially in recent years. Since January 1980, goods-producing employment—the top-line category that includes construction, mining, manufacturing, and others—has decreased nearly 20 percent and remains nearly 4.5 million jobs below its 1980 level. Service employment, on the other hand, has grown by 94 percent since 1980 and from less than three times larger than goods-producing employment to more than six times larger today. As shown in Figure 1, service employment levels are much higher than goods-producing levels, meaning a percentage increase in service employment has a much larger effect on overall employment levels.
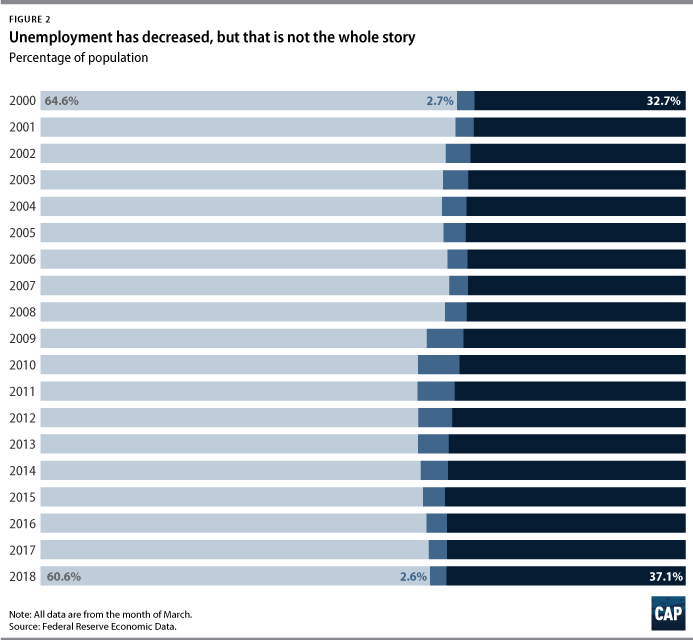
The unemployment rate is at prerecession levels, but other labor market health indicators have yet to recover fully
President Trump inherited a growing economy; however, there is still room for additional growth. Although the unemployment rate—the percentage of people actively looking for a job—is at prerecession levels, Figure 2 indicates that the employment rate—the percentage of the whole population that is employed—remains below prerecession rates, meaning that a larger percentage of people fall outside of the labor market now than in 2006. This likely indicates that many people have exited the labor market due to long-term unemployment and have not yet re-entered. It is good news that the number of long-term unemployed workers has continued to fall, but work remains to bring people back into the workforce. A recovery that reaches these workers is a key to long-term economic growth.
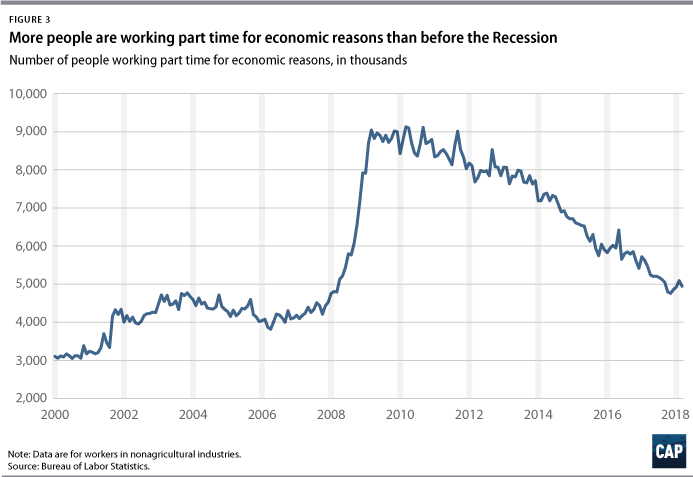
The number of people working only part time for economic reasons remains very high
The number of workers who are employed only part time for economic reasons—meaning that they are unable to find full-time work despite wanting it—remains high compared with prerecession levels. If workers are part-time because their hours are cut or because they cannot find a full-time job, that indicates a labor market that is less favorable for all workers. In March 2018, the number of involuntary part-time workers remained roughly the same at 4.9 million, which is still significantly higher than the precrisis low of 3.8 million in April 2006.
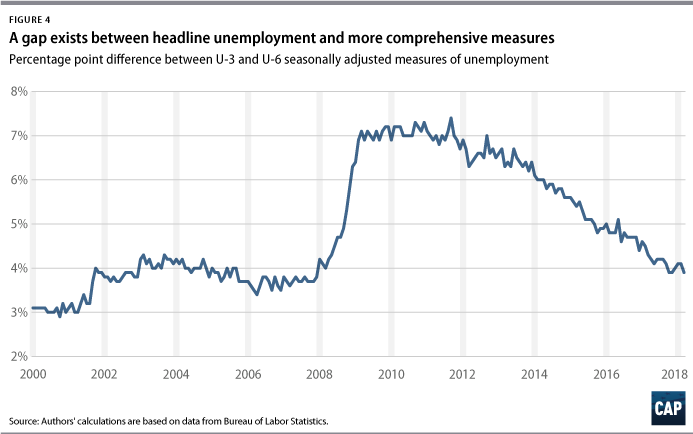
U-3 vs. U-6
The U-3 unemployment rate, the most common unemployment measure, can underestimate those who are unable to find jobs. For example, it does not capture the people who want jobs but have given up looking for work or the people who would like full-time work but can only find part-time positions. Perhaps the most comprehensive unemployment measure, U-6 alleviates this problem by including marginally attached workers—those who have recently looked for work but are not currently looking—and part-time workers who would prefer full-time work. A low U-6 indicates that people who face greater barriers in finding employment are being pulled back into the labor market due to greater economic opportunity. U-6 is always higher than U-3, but the gap grew much larger than usual during the recession and has remained above or near prerecession records over the course of the recovery.
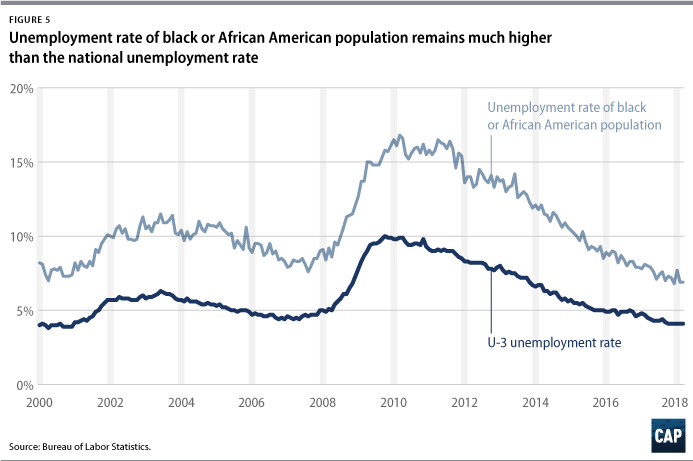
The unemployment rate has not recovered to prerecession rates for all demographics
The gains from the recovery have not been experienced equally among different demographics and those with historically worse labor market conditions continue to face higher unemployment rates with long-term detrimental effects. While the overall unemployment rate fell from 9.9 percent to 4.1 percent between March 2010 and March 2018, the rate for African Americans dropped from 16.8 percent to 6.9 percent during the same time frame. Focusing on the groups whose unemployment rates continue to have room for improvement should be a benchmark for the health of the U.S. labor market overall. Expanding their opportunities in the labor market can be a source of future economic growth.
Conclusion
This employment release will provide an updated snapshot of the real economy under the Trump administration. Since the administration has not created any progress on employment-related policies during its first year, it is unlikely that the April data will show any drastic changes. However, as President Trump continues his second year, the indicators highlighted above will be key in evaluating his policies. In order to maintain economic growth, the new administration must take these data seriously in its decision-making. Indicators such as the U-6 unemployment rate and the employment-to-population ratio show that there is still room to grow to meet previous eras of a strong labor market.
The Federal Reserve continues to be an important force in keeping the economy’s growth sustainable, but monetary policy is likely to be tested by economic uncertainty under the Trump administration. There is still room for the economy to grow, but it will require proactive labor market policy based on good data in order to improve the conditions that American workers face. The importance of sound economic data to guide and evaluate policy decisions cannot be understated. President Trump should embrace such data, such as the monthly jobs report, in the coming months and years to help shape his policy proposals.
Galen Hendricks is a special assistant for Economic Policy at the Center for American Progress. Michael Madowitz is an economist at the Center.