New statistics confirm what middle-class Americans have known for years: The economic recovery barely applies to them.
University of California, Berkeley, economist Emmanuel Saez has updated his frequently cited income data. And despite relatively good news about 2014, the picture they paint of the recovery is as predictable as it is discouraging. As of 2014, the top 1 percent of Americans have seen 58 percent of the gains in the economic recovery, while the average real income of the bottom 90 percent has grown just 1.6 percent since the recovery began in 2009.* These findings coincide with new data from the IRS showing that the top 0.01 percent received 5.6 percent of adjusted gross income in 2012.
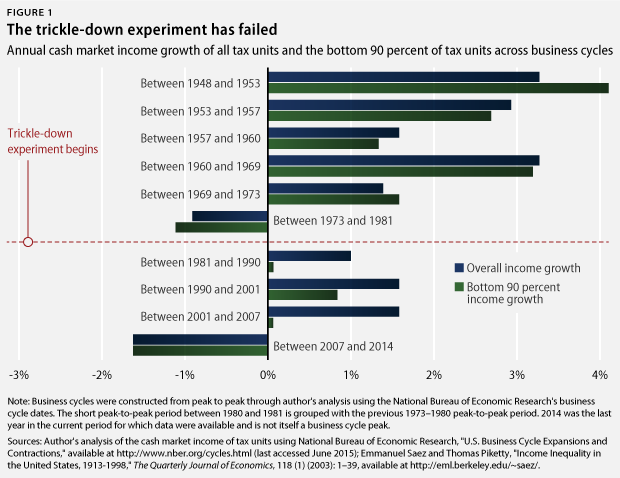
It has not always been this way. From the end of World War II to around 1980, a growing economy went hand in hand with growing middle-class market incomes. Figure 1 displays the real annual growth rate of overall income, as well as income for the bottom 90 percent, from business cycle peak to business cycle peak from 1948 to 2014. 2014 was not itself a peak, but rather the most recent year for which data are available; the last peak was in 2007. Overall and middle-class incomes grew at practically identical rates after World War II. The exception was between 1948 and 1953, when middle-class incomes actually grew at a much faster rate.
Around 1980, something changed.
Between 1981 and 1990, overall income grew 1 percent per year—not quickly but nonetheless a welcome change from the negative real income growth of the late 1970s. But the incomes of the bottom 90 percent grew less than 0.06 percent per year. While the economy grew in the 1980s, the vast majority of gains went to those at the very top. In the 1990s, the situation improved: Overall incomes still grew faster than middle-class incomes, but middle-class incomes still grew almost 1 percent per year.
The most discouraging periods are the two most recent—between 2001 and 2007 and between 2007 and 2014. From 2001 to 2007, overall incomes continued to grow at the same rate as they did in the 1990s, but middle-class incomes grew at less than one-sixteenth of the overall rate. During the Great Recession and the ensuing recovery, incomes of the bottom 90 percent began to move with overall income again. Unfortunately, this movement has been downward. The bottom 90 percent did not experience the boom of the 2000s but rather participated fully in the market income declines of the difficult recession and recovery.
Inequality and economic growth
These developments have been a natural experiment in trickle-down economics—the theory that tax cuts, deregulation, and the destruction of basic labor protections would unleash a wave of economic growth. A smaller share of the pie would go to most Americans, but they would be better off because these policies would grow the overall pie.
The experiment has failed.
Income certainly has shifted upward, but its benefits have failed to materialize for everyone else; middle-class incomes after 1980 only displayed strong positive growth in the late 1990s. Indeed, economic growth does not appear to grow middle-class incomes as it once did. At the same time, increased inequality does not appear to have delivered higher overall income growth: The pie has grown fastest and most sustainably during periods when the middle class got a sizable share. The only period that boasted overall income growth above 1 percent without strong middle-class income growth was the 2000s, and this growth was the result of an unsustainable housing bubble that greatly reduced overall income when it could no longer continue.
It appears that economic inequality has brought about its own malaise. International organizations such as the International Monetary Fund and the Organisation for Economic Co-operation and Development, or OECD, have concluded that high levels of income inequality reduce economic growth. Wall Street giants such as Morgan Stanley and Standard & Poor’s have reached similar conclusions.
Inequality reduces growth in the short term when aggregate demand and interest rates are low because the poor and middle class have higher spending rates than the wealthy. When the middle class has no money, businesses have no customers: As shown in a 2014 Center for American Progress report, more than two-thirds of retailers cited stagnant or shrinking disposable incomes as a risk factor for their stock prices. The wealthy tend to save their money, which helps finance investment, but 0 percent interest rates prove that financial markets have more savings than they can invest. Businesses do not invest simply because money is cheap—they invest because they think customers will buy their products. When real middle-class incomes grow just 0.3 percent per year, businesses have no reason to invest.
Inequality also has longer-term effects on growth, including reduced human capital and entrepreneurship. States and countries with stronger middle classes do better on the standardized tests used to measure student learning. A recent OECD report used several different approaches to study the relationship between human capital and inequality and found that “higher inequality lowers opportunities for education (and social mobility) for disadvantaged individuals in the society, an effect that dominates the potentially positive impacts through incentives.” Furthermore, a recent CAP report showed that America is missing 1 million entrepreneurs, partially because of the financial squeeze on the middle class.
The data released today offer two lessons for public policy. First, middle-class market incomes are not repairing themselves. Simply hoping that a better economy will cause them to increase ignores the lesson of the precrisis 2000s, a period when the economy roared and incomes for the bottom 90 percent barely budged. The middle class instead needs active policy solutions that produce inclusive prosperity. Second, trickle-down economics have failed to deliver higher overall income growth, which has been lackluster over the past 30 years. Healthy economic growth requires a healthy middle class, and a pro-growth policy agenda needs to focus squarely on everyday Americans.
Brendan V. Duke is a Policy Analyst for the Middle-Out Economics project at the Center for American Progress.
* Saez’s data use tax returns to measure “cash market income”—income received from wages, business, and capital. They do not include government transfers or the direct effect of taxes. This definition of income is useful for evaluating how the market distributes rewards, though it does not reflect the total amount of resources available to tax units. It is also useful because increased market income inequality explains the bulk of the increase in inequality after taxes and transfers.
Saez’s unit of analysis is the tax unit rather than the household. Another excellent dataset for studying income trends comes from the Congressional Budget Office, or CBO; it uses households as its unit of analysis. There are advantages and disadvantages to using tax units rather than households, and a potential concern with Saez’s data is that aging may be responsible for some portion of the declining growth rates of average incomes for the bottom 90 percent of tax units. However, there are clear advantages to using Saez’s data to study and compare the current business cycle to past business cycles: They are more recent and go much further back, allowing comparison of post-1980 business cycles with other business cycles after World War II. The CBO data, on the other hand, start in 1979 and end in 2011.