A lot of people seem to love the Simpson-Bowles plan, including Sens. Lindsey Graham (R-SC) and Saxby Chambliss (R-GA), who have recently expressed their support for “the Simpson-Bowles approach” to revenue increases. But does anybody know what’s actually in Simpson-Bowles? Two years after former Sen. Alan Simpson (R-WY) on the right and former White House Chief of Staff Erskine Bowles on the left—the co-chairs of President Barack Obama’s 2010 fiscal commission—introduced their proposal for deficit reduction, some policymakers and pundits herald the plan as a model for bipartisan compromise. But everybody seems to have a different take on what the plan actually does.
And when it comes to overall tax increases, the Simpson-Bowles proposal actually has a lot more than many people think. Relative to today’s tax policies, the Simpson-Bowles framework would bring in $2.7 trillion in additional revenue over 10 years—more than the president recommended in his 2013 budget, and a whole lot more than in the 2013 budget plan passed by the House Republicans.
If that $2.7 trillion number surprises you, don’t be alarmed. That’s because the Simpson-Bowles plan is often described as containing only $1.2 trillion in new revenue. But that’s only because the commission assumed that the Bush tax cuts for high-income taxpayers would expire, as would a variety of other expiring tax provisions. Together, allowing those tax cuts to actually expire would raise about $1.5 trillion in new revenue compared to today’s policies. In other words, Simpson and Bowles recommended layering their “$1.2 trillion” on top of what they assumed would be already-higher levels of revenue.
Policymakers today typically evaluate fiscal plans relative to some version of current policy. That means they assume that Congress extends all of the Bush tax cuts and most other expiring tax provisions. And to accurately compare Simpson-Bowles with other fiscal plans, the plan needs to be shifted forward to cover the same 10-year timeframe as other plans—2013 to 2022. So when compared with current policy, Simpson-Bowles raises $2.7 trillion from 2013 to 2022, not $1.2 trillion.
If this confuses you, you’re not alone. It’s always tricky to determine how much any deficit reduction plan raises taxes or cuts spending. That’s because those sorts of calculations are—by necessity—relative to some prediction about the future. In budget speak, we call that prediction the “baseline.” The problem is that everyone uses his or her own baseline, so it’s almost impossible to get an apples-to-apples comparison. The good news, however, is that there is a very simple way to figure out which plans raise the most in taxes: Forget about the baseline and just look at the total revenue level as a share of gross domestic product, the broadest measure of all economic activity.
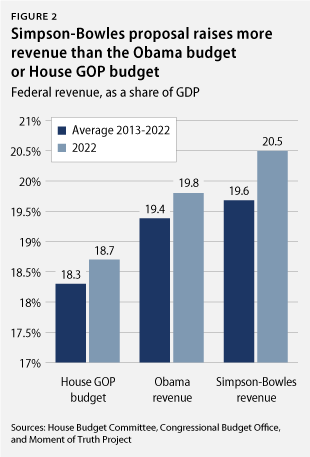
President Obama’s budget, for example, would result in revenue levels averaging 19.4 percent of GDP over the next 10 years. The budget plan passed by the House of Representatives would set revenue levels at 18.3 percent of GDP. These numbers make it obvious that the president’s budget raises more taxes than the House Republican plan. No need to worry about baselines.
The Simpson-Bowles plan calls for more revenue than both of those plans. Revenue under Simpson-Bowles would average 19.6 percent of GDP over the next 10 years. That’s nearly $500 billion more than President Obama’s budget proposal and $2.5 trillion more than the House budget. (see Figure 1, Figure 2, and Table 1)

Get ready to hear a lot more about the Simpson-Bowles plan over the next few weeks. As we get nearer and nearer to the so-called “fiscal cliff”—when a combination of automatic spending cuts and tax increases go into effect—there are going to be a lot of Beltway insiders who hold up Simpson-Bowles as the model for a bipartisan compromise on deficit reduction. But it is important to understand what the plan actually does. The Simpson-Bowles plan actually recommends more revenue than proposals on either side of the aisle—including the president’s budget.
Sarah Ayres is a Research Associate at the Center for American Progress. Michael Linden is the Director for Tax and Budget Policy at the Center.