See also: “Interactive: Exploring Infant Health Outcomes Across Race and Ethnicity and by State” and “Interactive: Opportunities for States To Improve Infant Health Outcomes” by Cristina Novoa and Mathew Brady
Author’s note: CAP uses “Black” and “African American” interchangeably throughout many of our products. We chose to capitalize “Black” in order to reflect that we are discussing a group of people and to be consistent with the capitalization of “African American.”
The United States is experiencing an infant health crisis. In 2017, it ranked 55th internationally on infant mortality, with a rate comparable to that of Serbia despite spending nearly 20 times more per capita on health care and having an economy four times the size.1 However, national data on infant health outcomes tell only part of the story. National averages conceal significant disparities in infant health outcomes that exist from state to state and across racial and ethnic lines. To address this crisis and see future improvement, states must implement evidence-based policies and invest in family support programs, ensuring that all infants have the opportunity to thrive.
In May 2019, a report by the Center for American Progress outlined policy solutions to improve maternal and infant mortality and eliminate racial disparities in maternal and infant health outcomes.2 This brief builds upon CAP’s earlier work by providing detailed information about infant health at the state level and pairing these data on health outcomes with information on state-level policy action. To help illustrate geographical and racial disparities in infant health outcomes, the accompanying interactive tools allow users to explore where and for whom the infant health crisis is most severe as well as what states are doing to address this challenge. Importantly, while this brief focuses on infant health, children’s outcomes are closely tied to mothers’ overall health before and during pregnancy, which is often influenced by certain structural or community factors. Therefore, this brief and the accompanying interactives consider maternal and community health indicators as well. Lastly, this brief highlights policy recommendations that would benefit both mothers and infants.
Exploring infant health outcomes across race and state
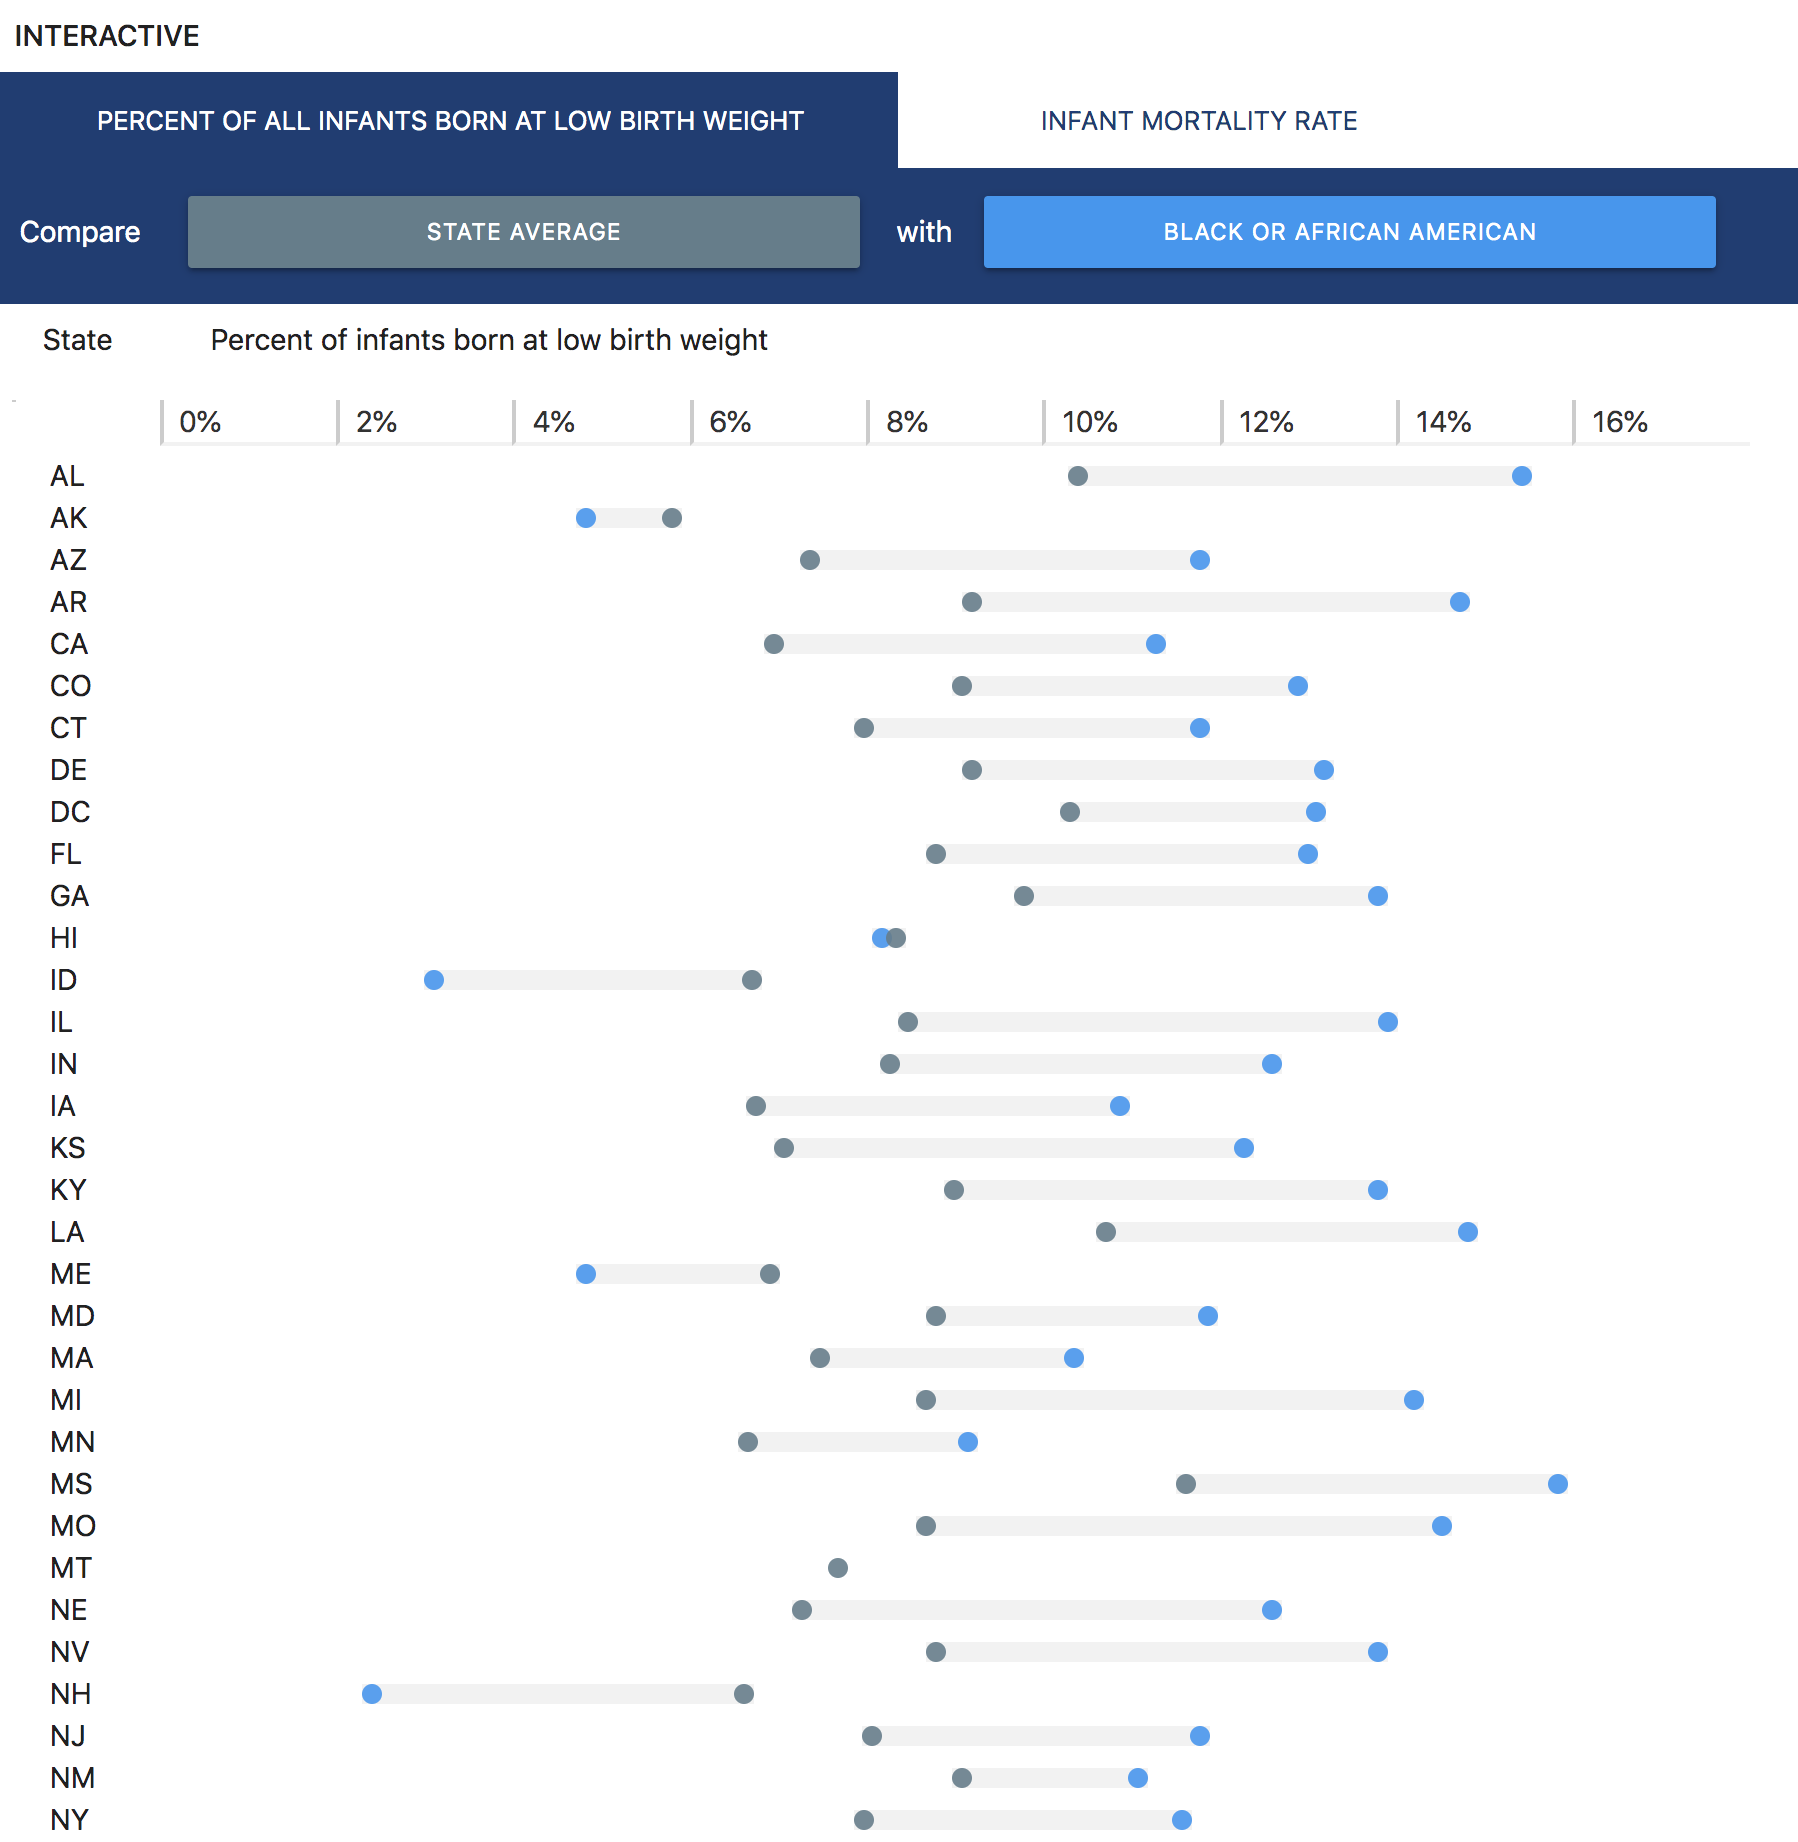
Interactive: Exploring Infant Health Outcomes Across Race and Ethnicity and by State
CAP’s interactive tool allows users to explore two important infant health outcomes—the infant mortality rate (IMR) and the percentage of infants born at a low birth weight—by race and ethnicity and by state. The first outcome, IMR, measures the number of infant deaths occurring before their 1st birthday for every 1,000 live births. Meanwhile, the second outcome measures the percentage of infants born weighing less than 5.5 pounds. Compared with their normal-weight peers, infants with low birth weights may be more at risk for certain health problems, including increased infection or mortality and longer-term developmental challenges.3 Although states collect this information and report their data to the Centers for Disease Control and Prevention, data on racial disparities at the state level are not always readily available or up to date.4
This interactive tool offers users a simplified way to explore the most recently available data on infant health outcomes within states and disaggregates these data by race and ethnicity.5 Where available, data estimates are shown for five demographic groups: white; Black or African American; American Indian or Alaska Native; Hispanic; and Asian or Pacific Islander.6 For each outcome, users can compare any two groups in order to see how outcomes differ by race and ethnicity across states. The interface also allows users to compare any group’s outcome with the state average.
The results show that infant mortality and low-weight births often depend on race and where a baby is born. For example, white infants born in New Jersey have an infant mortality rate of 3.4 deaths per 1,000 births, which is comparable to the infant mortality rate in Germany.7 However, Black infants born in Wisconsin are dying at close to five times this rate: 15 deaths per 1,000 births, a rate higher than that of Syria.8 Across nearly all states, infant mortality for Black and American Indian or Alaska Native infants exceeds the national average. For example, Massachusetts has the lowest Black infant mortality rate at 7.4 deaths per 1,000 births, yet this is still well above the overall national average of 5.8 for infants of all races. Moreover, in nearly all states with an American Indian or Alaska Native population large enough to compute an infant mortality rate, the level far exceeds the national average. Trends in low-weight births are similar in that, both nationally and within most states, a larger percentage of Black infants are born at a low birth weight compared with white infants.
The United States clearly has a long way to go to ensure good health outcomes for all infants. Improving infant health requires coordinated action from stakeholders working across policy areas and all levels of government, including states.9 The following section provides insight into the policies states have enacted to improve infant health and identifies which states are leading these efforts.
Measuring states’ progress toward better outcomes for infants

Interactive: Opportunities for States To Improve Infant Health Outcomes
The above interactive allows users to explore steps states have taken to improve infant health and to compare how they perform with regard to overall infant health outcomes, racial disparities in health, and progress on policies and programs known to improve infant outcomes. These indicators are organized into three interrelated domains: healthy families, economic and work supports, and infant health outcomes. These indicators were selected based on their demonstrated impact on infant health and, particularly, their effect on low-income families and families of color.10
Healthy families
This domain refers to policy and community-level indicators that capture how well families in a state can meet their health care and physical needs, including in the following areas:
- Medicaid expansion: This measure reflects whether a state expanded Medicaid eligibility through the Affordable Care Act, which extends coverage to all adults with incomes of up to 138 percent of the federal poverty level (FPL) and includes essential health benefits for pregnant women. For this indicator, states are classified in one of three categories: those with no expansion, those that passed but have not implemented expansion, and those that have implemented expansion.
- Medicaid eligibility:This measure comprises two parts: the income limit as a percentage of the FPL up to which infants ages 0 to 1 are eligible for Medicaid, and the income limit up to which pregnant women and deemed newborns are eligible for Medicaid.
- Children’s Health Insurance Program (CHIP) eligibility: This measure examines CHIP-funded Medicaid coverage for infants as well as separate CHIP coverage for all children ages 0 to 18 by state, since not all states offer both eligibility pathways. For that reason, the value reflects the highest income-eligibility level across the two categories.
- Supplemental Nutrition Program for Women, Infants, and Children (WIC) coverage rate: This measure reflects the percentage of WIC-eligible beneficiaries who receive benefits, such as nutritional food, information on healthy eating, and breastfeeding promotion and support. This is a continuous indicator that could range from 0 percent to 100 percent.
- Infant home visiting coverage rate: This measure reflects the percentage of all infants served by evidence-based home visiting. Like WIC coverage, this is a continuous indicator ranging from 0 percent to 100 percent.
- Limited maternity care access: This measure reflects the percentage of all women of reproductive age—15 to 44 years old—living in areas with either no obstetric providers or limited access to maternity care, as defined by the March of Dimes.11
Economic and work supports
These indicators measure a state’s progress in enacting policies that improve infants’ health outcomes by reducing poverty and supporting parents’ ability to take paid leave from work. The following measures are included in this category:
- State earned income tax credit (EITC): This indicator shows whether a state has a tax credit to reduce the amount of federal income tax owed by lower-income working families.12 If a tax credit is nonrefundable, lower-income families with no tax liability receive no further income, whereas if a tax credit is refundable, the government will still provide a refund check to families with no tax liability. For this indicator, states are classified into one of three categories: those with no EITC, those with a nonrefundable EITC, and those with a refundable EITC.
- State child tax credit (CTC):This indicator shows whether a state provides parents a tax credit. Like the EITC described above, states are classified based on whether they have a CTC and whether it is refundable.
- State paid leave: This indicator shows whether a state or localities within a state have a paid family and medical leave law that provides workers extended time away from work for pregnancy-related medical conditions and after the birth of a new child, among other reasons.States are classified into one of four levels: those offering no paid leave, those offering local paid leave for public employees, those that passed but have not implemented a statewide paid leave policy, and those that have implemented a statewide paid leave policy.
- Paid sick leave: This indicator shows whether a state or localities within a state have paid sick leave laws that require employers to provide workers time away from work to access preventive care, to take their child to the doctor, or to care for their own or a family member’s illness.States were classified into one of three levels: those with no laws, those with only city or county laws, and those with statewide laws.
Infant health outcomes
In addition to these policy and program indicators, information about infant health outcomes and health disparities—provided in more detail in the first interactive—is included below and in the interactive.
- Infant mortality ratio: This represents the total number of infant deaths in the state per 1,000 live births.
- Low birth weight percentage: This represents the overall percentage of babies born at less than 5.5 pounds.
- Infant mortality disparity ratio: This is a measure used by epidemiologists to assess the extent to which outcomes vary by race. It compares the group with the lowest infant mortality rate with the average for all other groups. Lower disparity ratios are better, with a disparity ratio of 1 indicating no difference in health outcomes across groups.13
- Low birth weight disparity ratio:This is a measure similar to the infant mortality disparity ratio described above but instead using low birth weight data.
CAP selected these indicators based on the availability of recent, high-quality data for all 50 states and a research-backed connection between these indicators and infant health outcomes such as mortality, preterm birth, and birth weight. For each domain, states received a score ranging from 1 to 100 that reflects how well they are faring in that area, with higher scores representing better outcomes. See the Methodology for additional information on the scoring rubric.14
Findings
Analysis of the data presented in these two interactives highlights several stark findings making clear that significant progress still needs to be made in order to ensure healthy outcomes for all infants.
The benefits of public health insurance for women and families have not been fully realized
As of publication, 14 states have yet to expand Medicaid, and another three have not yet implemented its expansion. Meanwhile, 34 states have implemented Medicaid expansion, giving pregnant women in those states and their families greater access to lifesaving health insurance. From 2010 to 2015, states that expanded Medicaid saw Black infant mortality decline at twice the rate of those states that did not expand Medicaid, thereby reducing the disparity between white and Black infant mortality rates.15
While federal law requires states to provide pregnancy-related services to pregnant women with family incomes of up to 138 percent of the FPL during pregnancy and 60 days postpartum, the types of services vary by state.16 For example, some states limit coverage to pregnancy-related services. CHIP offers coverage to pregnant women and children in households with incomes too high to qualify for Medicaid, although 40 states administer combined Medicaid and CHIP programs.
No state provides WIC supports to all eligible participants
Although states serve most eligible infants, less than half of eligible pregnant women receive benefits.17 Montana, the state with the lowest rate of WIC coverage, serves only 38 percent of eligible participants; on the other end, Maryland serves 68 percent of eligible participants. Adequate maternal nutrition throughout pregnancy and during the postpartum period is essential for supporting both infant and maternal health. Moreover, since women of color—particularly Black and American Indian or Alaska Native women—are more likely to rely on nutrition assistance programs such as WIC, state policymakers interested in addressing racial disparities in infant health should do more to ensure that families receive the services for which they are eligible.
Only a small percentage of infants are served by evidence-based home visiting programs
States serve only a small percentage of their infants through evidence-based home visiting. At the low end, Nevada provides home visiting to less than 1 percent of its infants, whereas at the high end, Maine serves 13 percent of its infants. Home visiting, which is shown to improve correlates of infant mortality such as maternal depression, represents a critically underdeveloped strategy for addressing maternal and infant health. Policymakers should invest in this strategy by increasing home visiting budgets and strategically expanding programs, especially those for young infants.
Many women live in maternity care deserts
Traveling long distances to access maternity care is associated with increased infant mortality.18 Yet statistics on access to maternity care show that many states—particularly those in the southern and central parts of the country—still have significant populations of women living in areas with limited or no access to maternity care from OB-GYNs or certified nurse midwives. However, these data provide a one-dimensional measure of access to maternity care based on geographic proximity and may not comprehensively reflect access to care. Some small states, such as Rhode Island, and Washington, D.C., have no women living in areas with limited access to maternity care, as defined by the available data, yet many still struggle to get the care they need. In these small states, barriers such as limited capacity in existing hospitals and poor transportation may limit care. For instance, anecdotal evidence suggests that many residents in Washington, D.C., have struggled to access maternity care in recent years following the closure of two maternity wards serving predominantly Black or immigrant residents, often due to long wait times and frequent rescheduling.19 To help address these care shortages, policymakers need to better understand where pregnant people lack access to maternity care so they can deploy resources to better serve them and their families.
Many states have a long way to go toward implementing supportive work and economic policies
California is the only state to have implemented all four policies identified in the domain on economic and work supports—paid family leave, paid sick leave, state EITC, and CTC—while nine states have not implemented any of these policies. Implementing such policies can significantly improve infant health. For example, states that implemented EITC saw improvements in infant health outcomes related to the refundability and generosity of the credit. According to one study, state EITC policies were found to prevent between 4,300 and 11,850 low-weight births every year.20 Similarly, if the United States were to implement 12 weeks of paid family leave, an estimated 600 infant deaths could be avoided per year.21
Conclusion
Infants’ health and survival is closely linked to race and geography. The country’s infant health crisis disproportionately affects communities of color—especially Black and indigenous communities. Yet lawmakers, program leaders, and advocates at all levels can change this pattern. Doing so will require leaders to coordinate efforts, set concrete goals around improving health, and continually evaluate progress toward these goals.
Cristina Novoa is a senior policy analyst for Early Childhood Policy at the Center for American Progress.
Osub Ahmed, Diana Boesch, Maura Calsyn, and Jamille Fields Allsbrook provided critical feedback and input on this brief and the domains included in the interactive. Steven Jessen-Howard assisted in collecting indicators, while Diana Boesch, Connor Maxwell, and Shabab Ahmed Mirza were instrumental in checking data. Thanks also to Shilpa Phadke, Katie Hamm, and Simon Workman for their assistance.