American families are struggling with the costs of child care—a key element in the ever-rising expenses associated with middle-class opportunity. Quality, affordable child care allows parents who want to work to stay in the labor force, encourages the healthy development of young children, and supports families at a stage in their lives during which small investments return large social dividends.1 Absent large-scale policy action on this issue, young adults have reported child care expenses as the top reason they are having fewer children than they would like.2 In fact, in 2018, the U.S. fertility rate fell to a record low for the third straight year, falling below the replacement rate needed to keep the population constant from one generation to the next.3
For those who do have young children, parenthood in the United States can feel like a relentless series of financial challenges. Over the past two decades, middle-class wages have barely kept pace with the rate of inflation, while the costs of securing a family in the middle class—including the necessary costs of housing, education, health care, and child care—have risen considerably.4 During this same time, income inequality has escalated, with wealth and incomes for the top 1 percent and the upper middle class pulling away from the rest of Americans.5
Under the current policies, most parents must cover the full cost of child care on their own, an expense that few can afford. Even low-income families—whose children likely qualify for child care assistance—are often forced to pay for child care, since fewer than 1 in 6 subsidy-eligible children receives assistance.6 Meanwhile, to the extent that child care is affordable for parents at all, this is only because the child care workforce effectively subsidizes child care costs with low worker wages. The typical U.S. child care worker earns just $11 per hour.7
In reality, most young children have working parents, making child care integral to family life.8 To understand better the cost burden on families and the types of arrangements that parents make to manage financially, this issue brief examines recent data on child care payments and patterns that provide insight into the types of child care that families use. This issue brief reports findings from a new analysis of child care spending data from the most recent wave of the Survey of Income and Program Participation (SIPP), released in May 2019.9 (see Methodological note) This nationally representative survey, designed and implemented annually by the U.S. Census Bureau, offers broad-ranging, detailed information on households’ income dynamics, assets, health insurance, employment, participation in assistance programs, and child care arrangements, among other subjects. The author analyzed family incomes, demographics, child care spending, and the number and types of child care arrangements used by families with at least one child under age 5.
An overview of the SIPP results
The results of the child care spending analysis show that among working families with children under age 5 that pay for child care, average child care spending amounts to nearly 10 percent of the average family income, or 40 percent higher than the U.S. Department of Health and Human Services’ definition of affordability.10 This is also an 11 percent increase from the 8.9 percent of average family income spent on child care that the U.S. Census Bureau found in a 2013 analysis of SIPP data.11 Lower-income families spend a much higher percentage of their income on child care, while higher-income families spend more overall. This is not surprising, given that higher-income families use licensed child care—which is likely to be safer and of higher quality—much more frequently than lower-income families. Finally, all families, regardless of their income level, frequently juggle multiple child care arrangements, with more than half of young children in multiple child care arrangements and nearly one-quarter using three or more arrangements.
Increases in the share of families paying for child care and the amount they are spending would not necessarily be a bad thing if families were using higher-quality care for their children. However, the findings in this issue brief show that middle-class and low-income working families have less access to licensed child care but must spend a larger share of their income when they do pay for child care. It is important to consider the long-term economic impacts of these findings, as the middle class is shrinking in most metropolitan areas and wage growth is increasingly concentrated among the richest households.12 A public investment in child care can effectively act as wage increases for millions of middle-class and low-income families, who are often in their lowest earning years as young adults.
Child care spending among working families with young children
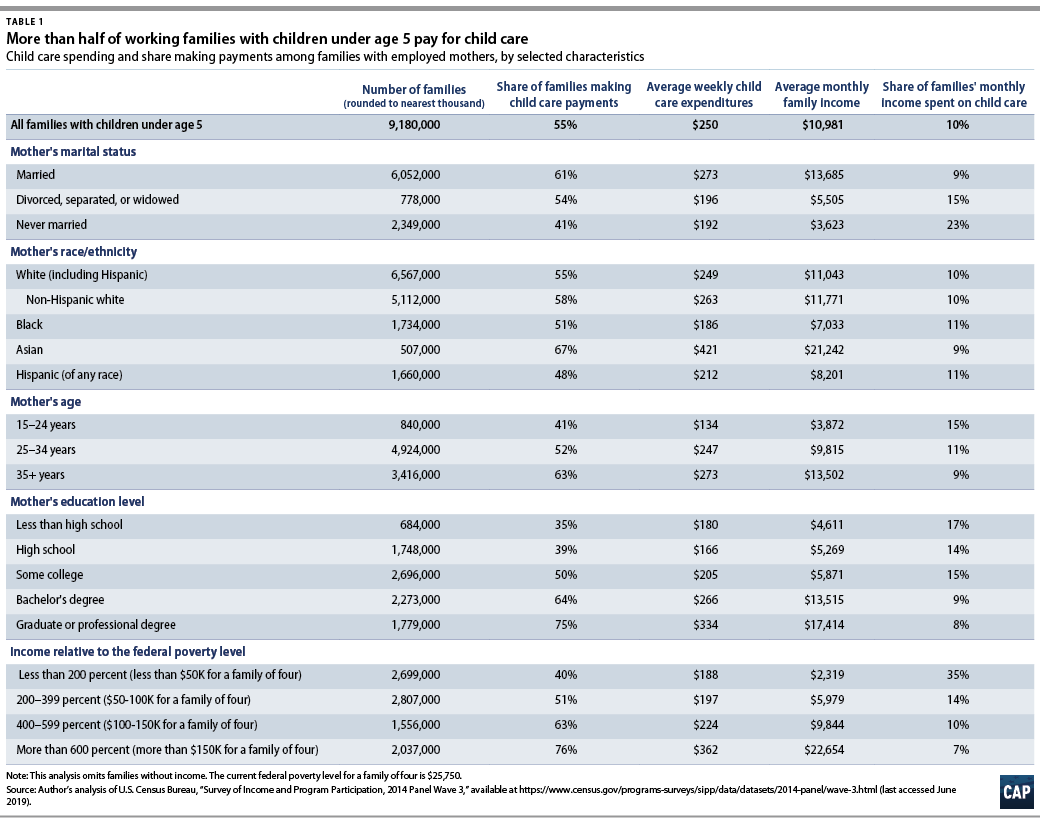
According to the U.S. Department of Health and Human Services (HHS), child care is considered affordable if it costs families no more than 7 percent of their income. Across nearly every category—whether it be marital status, race, age, education level, or income—families paying for child care spend, on average, a greater share of their income than the HHS benchmark of affordability.13 In fact, on average, working families paying for child care spend about 40 percent more than what is considered affordable.14 The Survey of Income and Program Participation asks parents how much their family spends on child care in a typical week, for all children under age 15. While most child care spending is on care for children younger than age 5, school-age children with working parents can also require child care before or after school.15 The resulting household-level estimates of child care costs consider the full array of child care expenses that families incur so that parents can participate in the workforce.
A descriptive summary of child care spending by demographic variables is presented in Table 1. It shows the number of families with children under age 5, the percentage of families making child care payments, and the average income and child care expenditure among families with children under age 5 in which the surveyed parent—almost always the mother—is employed.16 The author uses the term “working families” to refer to these households in the discussion of the findings.
These 5.1 million working families spent an average of $250 per week on child care, which is about 10 percent of the average family income.17 Since child care expenditures were recorded slightly differently in the 2014 SIPP than in the 2008 SIPP, this increase in child care spending could be partly due to changes in the survey design.18 Additionally, without more information about the quality of the child care these parents are paying for, it is difficult to determine whether this increase in spending comes from rising costs of child care or greater demand for higher-quality child care.
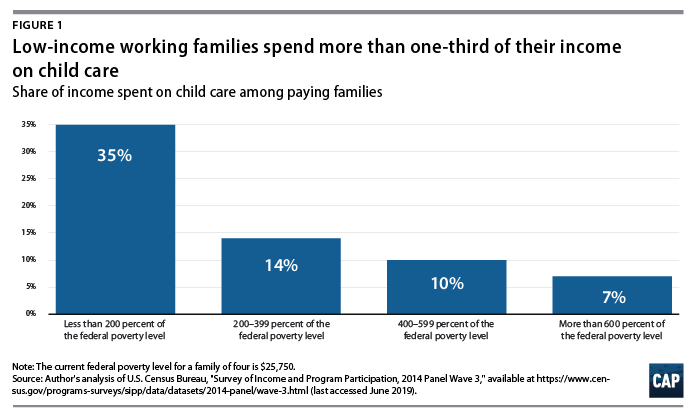
About 30 percent of working families with children under age 5 are considered low income.19 Only 4 in 10 low-income working families pay for child care, but among those that do, child care costs consume 35 percent of their income—five times more than what is considered affordable. Middle-class working families making from 200 percent to 399 percent of the federal poverty level are spending an average of 14 percent of their income on child care, which is twice the child care affordability standard. (see Figure 1)
SIPP data show that high-income families are much more likely to pay for child care. As other research has noted, while the mean of child care spending has risen dramatically in recent years, the median has not risen as quickly.20 This is because high-income parents are increasing their investment in their children’s care and education at a faster rate than ever before.21 This raises concerns about widening inequalities among young families in the absence of wide-ranging public investment in early care and education.
The overall share of working families paying for child care increased by more than 20 percent since the last SIPP census report, rising from a rate of 45.5 percent of families to 55.3 percent.22 The largest increases in the share paying for child care were among families with mothers over age 35, Non-Hispanic white mothers, Asian mothers, and mothers with a bachelor’s degree or higher. Each of these groups is associated with higher family incomes than the other groups within their category—race or education level, respectively—supporting the observation that higher-income families are more likely to pay for child care.
As with the percentage of families paying for child care, there are differences in the share of family income spent on child care between groups with different demographic characteristics. For example, unmarried parents spend more than twice what married couples spend as a proportion of their family income. Parents without a high school degree spend a much bigger portion of their paycheck on child care than parents who are college graduates, though they are only half as likely to pay for it at all. Unmarried parents and parents without a high school degree earn less, on average, than groups that spend a smaller share of their income on child care. In absolute terms, these families pay less for care than their higher-income peers. Relative to their lower incomes, however, child care is a larger expense for these low-income families.
Number and type of working families’ child care arrangements
The cost of child care can vary significantly by the type of child care. Families often consider a variety of factors when selecting child care, including cost, location, quality, and operating schedule. For low-income families, cost and location constraints are driving factors behind the type of child care they use. Table 2 reports the share of children in each type of child care arrangement recorded by the SIPP. The survey allows parents to indicate as many child care arrangements as they need for each child, although the number of hours is not recorded for each care arrangement. Thus, this analysis cannot determine the primary child care arrangement where the child spends the most time. For this table, the author has combined substantially similar categories for the sake of comparability with previous Census Bureau analyses of the SIPP.23 The population of interest for this analysis is the estimated 15.7 million children under age 5 in at least one child care arrangement while their parents are working, in school, or otherwise unavailable to care for them.24
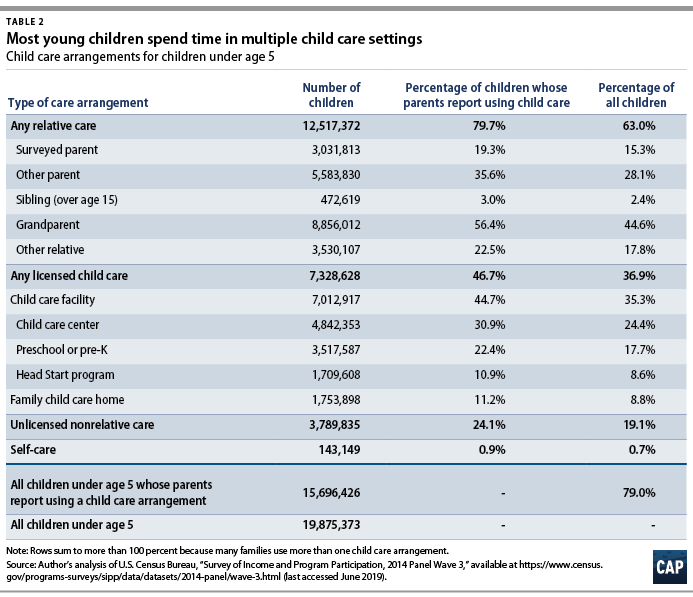
For this population of young children, there are three broad child care categories: relative care, which includes parents, siblings, and grandparents or other relatives; licensed child care, which includes child care centers, preschool or pre-K, Head Start programs, and family child care homes; and other child care arrangements, such as self-care, in which the child is left alone without a caregiver, or unlicensed nonrelative care. An estimated 80 percent of children under age 5 spend at least some time with a relative during the week; 47 percent spend some time in licensed child care; and 24 percent spend some time in an unlicensed, nonrelative child care setting. About 56 percent of young children who need child care spend at least some time in the sole care of a grandparent.25 Typically, this is not their only child care arrangement. More than half of children under age 5 who need child care are in two or more care arrangements, with 25 percent in three or more care arrangements. While grandparent care is most common, a growing share of children under age 5—47 percent—spend at least some time in a licensed child care setting such as a child care center, pre-K, Head Start programs, or a family child care home. These categories sum to more than 100 percent because most children are in multiple child care arrangements.
After dividing the larger category of relative care into three distinct groups—nuclear family, grandparents, and other relatives—the author examined the prevalence of multiple care arrangements across the resulting five basic child care types: licensed care; nuclear family care; grandparent care; other relative care; and nonrelative unlicensed care. Using these five categories, this study finds that 56 percent of young children spend time in at least two types of child care, with 24 percent spending time in three or more types of care and 5 percent spending time in four types of care.26
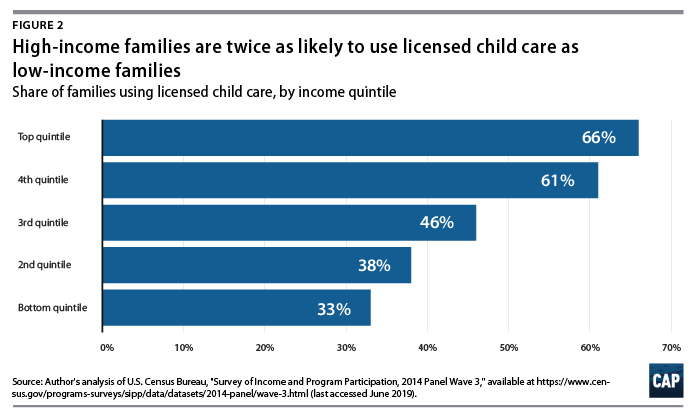
Use of licensed child care for children in families in the top income quintile is twice as high as use in the bottom income quintile. (see Figure 2)27 States set standards that child care providers must meet in order to become licensed in that state, including the number of children a provider can care for before licensing is required, fireproofing, and minimum adult-to-child ratios. Nonprofit, for-profit, or publicly funded child care providers make up the licensed child care market. The increased rate of licensed child care among high-income families is likely part of the reason that high-income families are more likely to pay for child care, as well as why they are paying more for child care, on average.
Conclusion
Child care affordability should be a central goal for policymakers pursuing an inclusive growth strategy for the American economy—one that generates short-term as well as long-term economic benefits. Lawmakers must act to invest in solutions that increase child care supply, support child care workers, and make quality child care affordable for working families. The recently reintroduced Child Care for Working Families Act is one current proposal that addresses costs while also ensuring quality. It does so by greatly increasing child care assistance for low-income and middle-class families and raising wages considerably for the underpaid child care workforce.28
Better work-family policies are likely to pay for themselves in the long run, while acting as an economic catalyst for labor supply in the short run. An equitably designed policy approach can also direct many of the benefits to women, middle-class working families, and families of color, who have shouldered the cost of policy inaction for decades. A progressive economic growth strategy that includes bold child care investments will help families at a critical moment in their lives, allowing more young parents to stay in the labor force while improving the quality of child care for millions of children.
Rasheed A. Malik is a senior policy analyst for Early Childhood Policy at the Center for American Progress.
Methodological note
For this issue brief, the author analyzed the 2014 panel of the Survey of Income and Program Participation, which conducted annual waves of interviews with a nationally representative sample of about 53,000 households and was released in 2019. This analysis uses data from Wave 3, for which interviews were completed in June 2016. Questions about child care arrangements were asked of the reference parent for each child under age 15. In most cases, the mother is the reference parent. If neither parent is in the household, the guardian is the reference parent. Usage of child care arrangements, as well as child care expenses, refer to a typical week in December of the reference year, which for Wave 3 interviews is 2015. The SIPP does not collect information on hours, location, or cost per arrangement. Reference parents were asked about how much they spent on child care overall, for all arrangements for all their children.