Introduction and summary
Over the past 15 years, the share of 4-year-olds who are U.S. residents attending public preschool has more than doubled to 33 percent.1 A growing number of cities and states have dedicated resources to establish or expand preschool programs, with policymakers frequently citing the impact that preschool participation has on school readiness.2 Preschool attendance has been shown to improve children’s academic and socio-emotional skills, preparing them for kindergarten and beyond.3 Research also shows that effective preschool programs benefit children from disadvantaged families the most, providing those children with a nurturing environment for healthy development.4
Moreover, along with these important educational benefits, public preschool also allows some parents to re-enter the labor force or increase the number of hours they work, providing a decided boon to families’ economic well-being. That has been the experience in Washington, D.C., where parents—specifically mothers—have returned to or entered the workforce in significant numbers since the city expanded to universal preschool.
Unfortunately, that is not the case for millions of parents throughout the United States, who report cutting back on hours or making career sacrifices due to challenges related to child care.5 Since private tuition for high-quality, full-day preschool can cost many thousands of dollars per year, free public preschool has the potential to significantly increase take-home pay for parents.
In 2009, Washington, D.C., began an ambitious expansion that offers two years of universal, full-day preschool across the city’s public schools, public charters, and some private preschool programs administered by community-based organizations. As of 2017, approximately 9 out of 10 of the District of Columbia’s 4-year-olds and 7 out of 10 of the city’s 3-year-olds were enrolled in publicly funded preschool through the expansion. While policymakers introduced universal preschool in the District of Columbia with the goal of improving school readiness, young parents soon found those two years of free, high-quality child care to be an economic benefit.6 On that premise, this study estimates the effect that the city’s universal preschool program has had on the city’s maternal labor force participation rate in the years since the policy was enacted.
This report focuses on maternal labor force participation—in this case, mothers with a child younger than 5 years old—because most frequently, the parent who is on the margin of participating in the labor force is female.7 For the purposes of this report, the term “young children” refers to those under 5 years old, and the term “maternal labor force participation rate” refers to the share of women whose children are under age 5 and who are either working or actively seeking employment.
Some of this study’s key findings include the following:
- In the years since Washington, D.C., began offering two years of universal preschool, the city’s maternal labor force participation rate has increased by about 12 percentage points, with 10 percentage points attributable to preschool expansion.
- District of Columbia mothers with young children now participate in the labor force at about the same rate as District of Columbia mothers whose children are in elementary school.
- Maternal labor force participation increased among both low-income and high-income families. Maternal labor force participation was unchanged for middle-income families during the study period and is examined below.
- Women with young children also saw large increases in employment, with boosts to full-time work for married women and part-time work for unmarried women.8
These results suggest that two years of universal, full-day preschool is associated with a large positive effect on maternal labor supply—comparable in magnitude to the impact found in studies of universal preschool programs in other countries. On a national scale, policies that support maternal labor force attachment could contribute to faster growth in gross domestic product (GDP); stronger financial security for young families; and fewer career sacrifices by women, who assume a disproportionate share of their families’ care responsibilities.
For these reasons, among others, the United States should consider universal preschool and expanded child care assistance as part of a broad economic growth agenda. Providing full-day, year-round child care for working parents will benefit millions of families, increase the lifetime earnings and savings of women, and bring women’s labor force participation rates into line with women’s rates in other advanced economies.
Background and prior research
For several decades, the postwar American economy grew at a breathless pace, in no small part due to a rapidly expanding labor force. Much of the growth in the U.S. labor force came from women working outside the home at considerably higher rates than ever before. In fact, the Congressional Budget Office (CBO) estimates that labor force growth, driven primarily by the entry of women, added about 1.7 percentage points per year to the average growth in gross domestic product between 1948 and 2001.9 During this period, the labor force participation rate for mothers with young children grew faster than for any other category of women, skyrocketing from just 10 percent in 1950 to more than 60 percent by 2000.10 Since that time, however, both female and maternal labor force participation rates have remained flat or declined slightly.11
In recent years, a growing body of research has found evidence to support the claim that much of the remaining labor force participation gap between men and women is connected to motherhood and the gender norms of child care responsibilities.12 Some studies have even connected the lifetime wage and earnings gap to the impact that childrearing has on mothers’ earnings and careers.13 This “motherhood penalty” is even matched by what is termed a “fatherhood bonus,” with men tending to be paid more after they have children, the assumption being that as the breadwinner, a man’s extra income is for the benefit of the children.14 While social norms around child care duties are not likely to change quickly, surveys consistently indicate that many women are making career sacrifices and employment decisions in the face of costly, scarce, and sometimes low-quality child care options.15
A recent review of the research literature on this subject shows that economists are keenly interested in how the plateau in female labor supply is related to child care duties, which interfere with mothers’ labor force attachment more than any other factor.16 One of the largest sections of the literature focuses on the labor force decisions of low-income or nonworking single mothers who suddenly receive child care subsidies; it finds large and positive effects on labor force participation.17
Several other studies have examined the introduction and expansion of kindergarten in past decades, and their findings offer insights into the labor effects that subsidized preschool or child care may produce. By and large, this research shows that kindergarten enrollment almost always increases labor supply among single mothers, though some studies only find increases among single mothers of 5-year-olds who do not have additional young children.18 One finding that is particularly relevant to this report is that mothers whose children attended full-day kindergarten programs were more likely to work full-time than those whose children attended half-day programs.19
There have been only a few U.S. studies estimating the effect of universal preschool on maternal labor force participation, and these have focused on statewide preschool expansions such as those in Oklahoma and Georgia. Using a regression discontinuity design and the synthetic control method (see Methodological Appendix), these studies found little to no effect on maternal labor force participation in Georgia and Oklahoma.20 While these two states were among the first to fund universal preschool in the 1990s, their programs have never served 3-year-olds, and some Oklahoma preschools only offer half-day programs.21
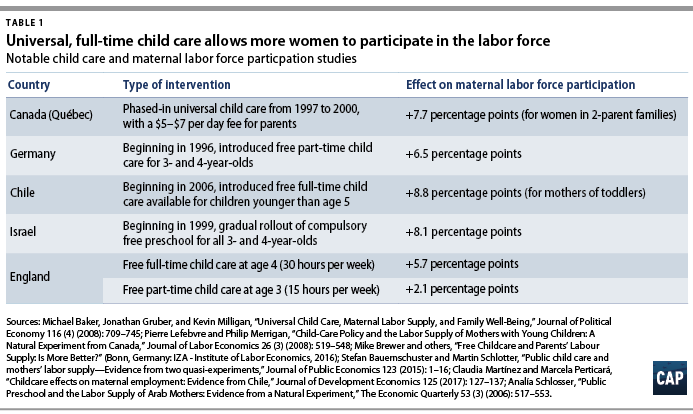
On the other hand, in recent years, there have been numerous international studies of universal child care programs, since many foreign countries have started providing free preschool and/or child care to parents. Economists have consistently found—in places as diverse as Canada, Germany, Israel, Chile, and the United Kingdom—that offering free preschool or child care appears to increase maternal labor force participation rates from 5 percentage points to 10 percentage points. (see Table 1) Notably, each of these programs is unique, with cultural aspects that differ greatly from the U.S. context.
Maternal labor force participation in Washington, D.C., during universal preschool expansion
This report examines the effect of providing two years of free, full-day preschool on the labor force participation of women with young children. Fundamentally, the reduction of families’ child care costs for two years increases the overall value of employment, which should encourage some parents to enter or re-enter the labor force. Although several cities now offer universal or near-universal preschool, one of the most robust, high-quality preschool programs is found in the nation’s capital.22
Washington, D.C., has offered public preschool to many low-income families since the 1970s, but in the past decade, the city has invested in universal, full-day preschool for 3- and 4-year-olds at funding levels comparable to K-12 education.23 Following the passage of the district’s Pre-K Enhancement and Expansion Amendment Act of 2008 (Pre-K Act), the city began offering publicly funded preschool through District of Columbia Public Schools; Washington, D.C., public charter schools; and some community-based organizations. Regardless of the setting, these public preschools are all subject to research-based quality standards, which have been established and administered by the District of Columbia Office of the State Superintendent of Education (OSSE).24 The program is open to all families living within the District of Columbia regardless of income, though early in the implementation, the law instructed the OSSE to focus expansion and quality improvement efforts on lower-income communities before pursuing citywide universal preschool.25
Expansion to universal preschool began in September 2009, and the OSSE was required to expand preschool each year to accommodate a minimum of 15 percent of the unserved children until preschool programs were available to all children of preschool age whose parents chose to participate.26 In just a few years, the city increased the share of 4-year-olds enrolled in public preschool from about 50 percent to near universal availability and participation.27 Among 3-year-olds, the city doubled public preschool enrollment from 33 percent to 66 percent. By 2016, approximately 77 percent of all 3- and 4-year-olds in the district were enrolled in preschool.28
Crucially, the district funds programs using the same funding formula as grades K-12, so that providers all operate five days per week for a minimum of 6.5 hours per day and 180 instructional days per year.29 This means that parents are still responsible for covering for aftercare and summer child care, though most schools offer these services for a fee. In 2017, the district spent $222 million on public preschool, or about $17,000 per child enrolled.30 For the sake of comparison, the state of Georgia spent about $4,000 per child enrolled in its universal preschool program.31 This is largely because the District of Columbia pays preschool teachers the same as elementary school teachers.32 In addition, some Georgia programs are only half-day.33
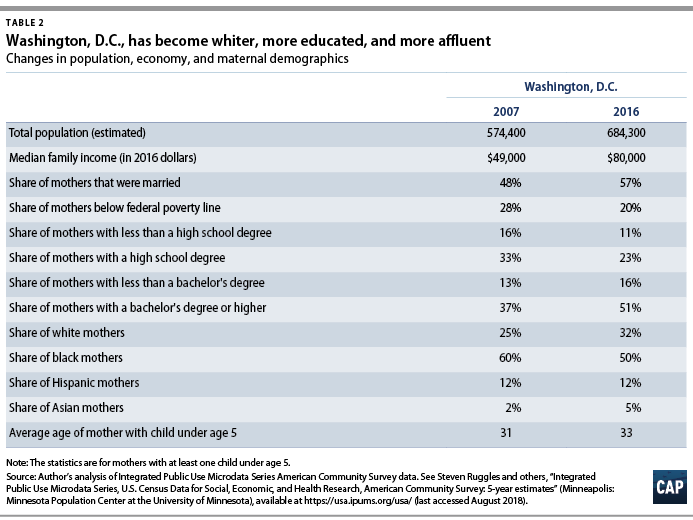
One of the fundamental challenges for any analysis of Washington, D.C., during this period is that the city experienced considerable population growth, which in turn altered its demographic profile. In 2007, nearly 70 percent of the city’s children were African American, and by 2016, that share had dropped to 55 percent.34 Over the same time period, the median income among households with children nearly doubled, from $42,500 to $75,000.35 Rising housing costs and gentrification in many traditionally African American neighborhoods led to outward migration among low-income residents, most often to neighboring Prince George’s County, Maryland.36 Meanwhile, the city’s white population has grown, as more whites have moved into the city and are more likely to stay once they start families.37 Table 2 details how the city’s overall and maternal population changed between 2007 and 2016.
It is important to note that Washington, D.C., also enacted some other pro-worker policies during this period that may have contributed to an increase in the maternal labor force participation rate. The city instituted one of the highest minimum wages in the country via the Living Wage Act of 2006, as well as guaranteed paid sick leave to all workers in the district through the Accrued Sick and Safe Leave Act of 2008.38
Maternal labor effects of universal preschool
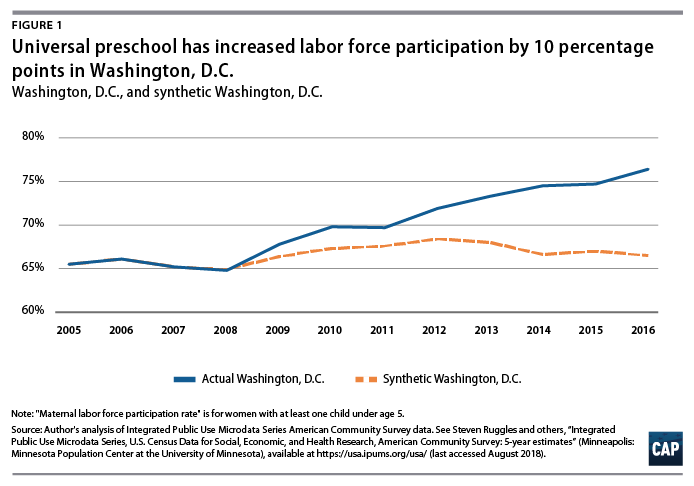
This report uses data from the 2000 decennial census and the 2005–2016 American Community Surveys to analyze the maternal labor force participation rates of women with at least one child under age 5 in Washington, D.C.39 Between 2000 and 2008, the city’s maternal labor force participation rate hovered around 65 percent. Following passage of the Pre-K Act, this rate increased dramatically, reaching 76.4 percent by 2016. This is the largest increase for any large city in the country over that period, and as a result the District of Columbia now has the highest maternal labor force participation rate among the 50 largest cities in the country. Using both a synthetic control method and a difference-in-differences analysis, this study finds that these increases in maternal labor force participation are strongly linked to the district’s implementation of universal preschool.
The synthetic control method compares the observed increase in maternal labor force participation with an estimate of how much that labor force participation rate may have increased or decreased in the absence of universal preschool expansion. Using statistical software, this analysis identifies a weighted combination of other cities—all of which do not have universal preschool—that when averaged together had rates of maternal labor force participation that were nearly identical to the District of Columbia’s in the period before the Pre-K Act was passed. The weighted collection of cities is referred to as the “synthetic control group.” Any differences in labor supply between Washington, D.C., and the synthetic Washington, D.C., in the period after the policy change provide a reasonable estimate of the effect that universal, full-day preschool has had on maternal labor supply.40
The post-2008 trend shown for synthetic Washington, D.C.—shown as a dotted line in Figure 1—indicates that without universal preschool expansion the city’s maternal labor force participation rate would have increased by about 2 percentage points. Nationally, the maternal labor force participation rate increased by 2 percentage points during this same time.41 This suggests that by 2016, universal preschool had increased the maternal labor force participation rate by approximately 10 percentage points.
This represents a 15 percent jump from the city’s baseline maternal labor force participation rate—a very large increase in employment and job-seeking among women with young children. While these results are roughly in line with several studies of universal child care in other countries, they show significantly larger maternal labor effects than previous studies of universal preschool in the United States. This may be due to the fact that no state preschool program has achieved participation as widespread as that seen in Washington, D.C. Statewide universal preschool programs offer a year of full-day or half-day programs, the latter of which may not provide mothers with enough time to pursue meaningful working hours. The District of Columbia shares more in common with other cities than states, a valid criticism of any comparison between the District of Columbia and larger states.
For a more detailed description of how the synthetic control method was implemented in this study, the data used in the analysis, and the limitations of this methodology, please see the Methodological Appendix.
In order to check the results of the synthetic control method analysis, this report features two separate difference-in-differences identification strategies. In the first, the two groups being compared are mothers of young children in Washington, D.C., and mothers of young children in Maryland and Virginia counties that share a border with Washington, D.C. In the second, the comparison is between District of Columbia mothers with children under age 5 and District of Columbia mothers with children from ages 6 to 11. By comparing the difference in maternal labor force participation rates between these groups before and after universal preschool expansion, this statistical method provides an estimate of the policy’s treatment effect, assuming that these families are equally affected by broader economic forces and changes to the labor market.
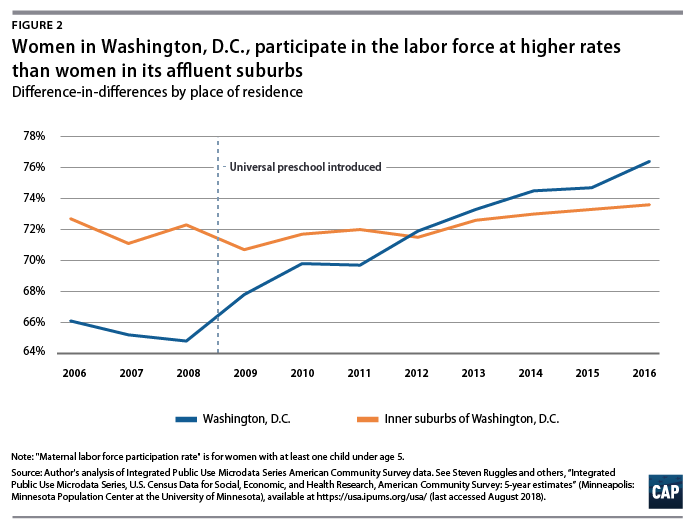
For the comparison of mothers with young children in Washington, D.C., versus those in communities adjacent to the district, the author estimated the maternal labor force participation in communities that border the district but are in either Maryland or Virginia. As shown in Figure 2, the maternal labor force participation rate in the inner suburbs of the district stayed relatively flat during this period, with the district rate overtaking it by 2013. Of course, since these are neighboring municipalities, there is a fair amount of migration between them. While two years of subsidized preschool may have enticed many families to stay in the city, those without young children may have migrated out of the city due to rising housing prices and cost of living. Without detailed data on migration in and out of the city, this remains an uncertain source of selection bias.
In a difference-in-differences analysis of District of Columbia mothers with children of different ages, the same trend can be observed. Women with only children of elementary school age continue to participate in the labor force at roughly the same rate as they have for more than a decade, while the rate for mothers with children under age 5 gradually comes up to equal that of mothers with school-age children. (see Figure 3) Note that the estimates for mothers with only children under age 5 are slightly different from the estimates in the synthetic control method analysis, as mothers who have young children but who also have children above age 5 are excluded from this comparison. This is done so that some women are not counted in both groups, which would compromise the analysis. For details on the methodology employed for this difference-in-differences analysis, including statistical output tables, see the Methodological Appendix.
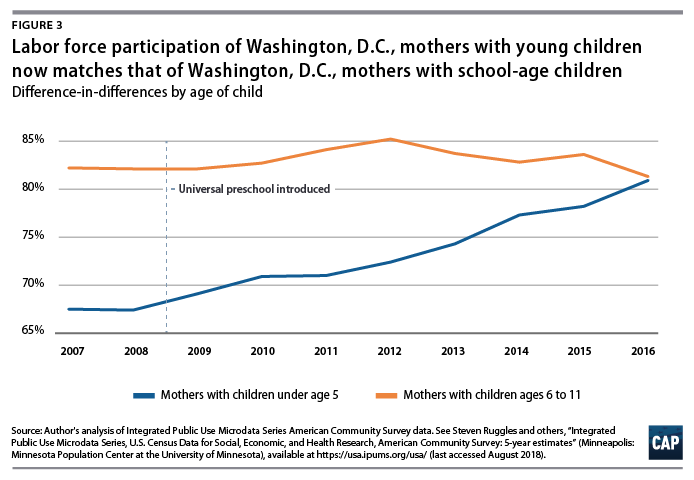
These two difference-in-differences estimates support the large effects estimated by the synthetic control method analysis. They suggest large, positive effects on maternal labor force participation from universal preschool. Nearby communities without universal preschool programs saw no such increase, and neither did District of Columbia mothers with school-age children. By 2016, District of Columbia mothers with children too young to go to elementary school were employed or actively seeking employment at the same rate as mothers with children in elementary school.
Differences in the labor supply effect by subgroup
Looking within the population of District of Columbia families, this study finds that there are significant differences in maternal labor force participation by marital status, education level, total family income, and race/ethnicity. Increases in maternal labor force participation are driven by both low-income and very-high-income mothers, while middle-income mothers have roughly the same maternal labor force participation as before universal preschool expansion. Low-income and unmarried women may have increased their labor force participation rates, but many are still unemployed or working part-time. Meanwhile, among high-income families, about 88 percent of mothers with young children were employed—a rate that is comparable to that of fathers of all income levels with young children.42
Perhaps most interestingly, increases to maternal labor supply accrue at both the bottom and the top of the income spectrum, with no aggregate changes among middle-class households. Women in families with incomes below the federal poverty level saw the biggest overall increases in labor force participation; rates for this group climbed 15 percentage points to 55 percent. Meanwhile, families with incomes above the federal poverty threshold but lower than 500 percent of the poverty level—about $125,000 for a family of four in Washington, D.C.—did not exhibit increases in maternal labor force participation.43 These families have consistently had high rates of maternal labor force participation in recent years, with about 75 percent participating in the labor force. However, at the top of the income distribution, mothers in families earning more than 500 percent of the poverty level are now participating in the labor force at rates comparable to their male counterparts—at roughly 88 percent. (see Table 3) Between 2008 and 2016, the maternal labor force participation rate for these high-income women increased by 13 percentage points.
As the District of Columbia’s population has become more affluent, this segment of high-income families occupies a larger share of the city’s maternal population. Between 2008 and 2016, the share of district mothers with young children (under age 5) living below the poverty level shrunk from 25 percent to 20 percent. Meanwhile, during that same period, the share of district mothers with young children living at more than five times the poverty level increased from 35 percent to 41 percent. While both groups have higher labor force participation rates, it appears that high-income mothers are disproportionately driving up the overall rate. This group is also much less likely to be unemployed, with an unemployment rate under 1 percent. All told, the city is home to approximately 25,000 women with a child under age 5, which means that a 10 percentage point increase in the maternal labor force participation rate is equal to an additional 2,500 women participating in the city’s labor force.
There are also differences in maternal labor decisions depending on marital status. In Washington, D.C., almost half of women with a child under age 5 are not married.44 The labor force participation rate for these women increased faster than the rate for married women with young children. This aligns with much of the prior research literature, which has recorded greater labor force participation gains for single mothers during expansions of subsidized child care.45 It is important to note that not all unmarried mothers are parenting alone, as a growing share of parents are cohabiting without marrying; these parents tend to be younger and less educated than unmarried, solo parents.46
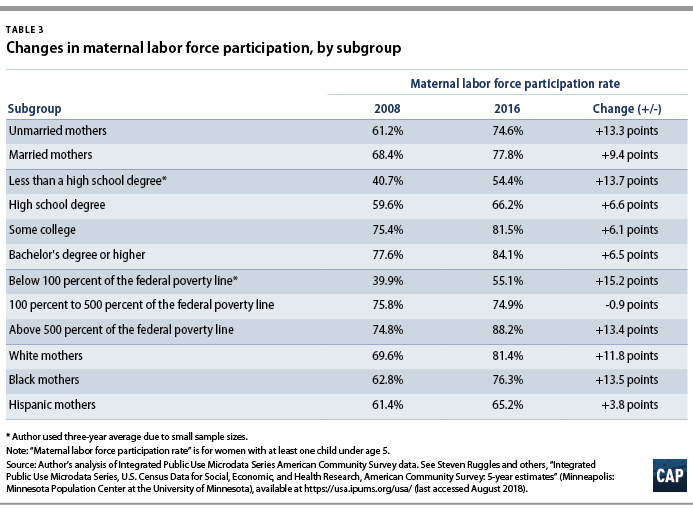
Across levels of educational attainment, the largest labor force participation increases were among mothers without a high school degree, with smaller, though significant, gains for mothers with more years of education—even those with a bachelor’s degree or higher. Again, this is consistent with a recent study of urban mothers’ labor force participation, which found that mothers with less than a high school degree have the hardest time re-entering the labor force, even after controlling for maternal characteristics. Mothers with fewer years of education are also more likely to work part-time, as well as experience persistently high unemployment.47
Finally, when analyzed by race and ethnicity, both black and white mothers had large increases in labor force participation rates. (see Table 3) Hispanic mothers, however, had only modest increases to labor supply, only rising by about 4 percentage points during this time. According to the author’s estimates based on 2016 census data, among the population of District of Columbia mothers with children under age 5, about 50 percent were black, 32 percent were white, and 13 percent were Hispanic.48
Additional findings regarding maternal employment
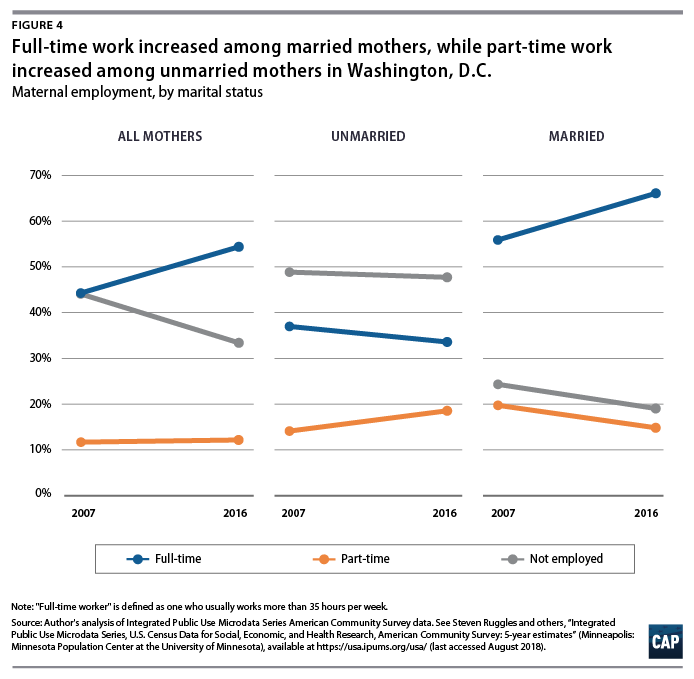
Another important question these results raise is whether increased maternal labor force participation was accompanied by higher maternal employment, and if so, how that employment was divided between part-time and full-time work. Between 2007 and 2016, the share of Washington, D.C., mothers whose young children were ages 5 and younger and who were employed rose from 56 percent to 67 percent. Married women exhibit higher rates of full-time employment, while unmarried women saw increases in part-time work, as shown in Figure 4.
Unmarried mothers are also much more likely to be participating in the labor force, but they are less likely to have found a job. Meanwhile, married women with young children worked part-time at a lower rate in 2016 than in 2007. During this period, the share of mothers with children ages 5 and younger who were married increased from 48 percent to 57 percent.
For more detailed findings, including a difference-in-differences analysis of maternal employment, please see the Methodological Appendix.
Policy implications
The results from this report’s analysis indicate a strong link between two years of free, high-quality preschool and significantly higher rates of maternal labor force participation and employment, at least among women with young children. These findings have implications for policymakers who may be weighing the costs and benefits of investing in universal, high-quality preschool. Among these are the short-term and long-term benefits to young families, the economic impact of greater labor force participation, the potential challenges that such an expansion may present for infant and toddler child care, and the risk of spurring urban gentrification as family-friendly policies induce some higher-income families to move into or stay within the city.
The District of Columbia’s universal, full-day preschool program provides excellent economic benefits to the city’s young families. As a two-generation policy, it offers high-quality early education for children while reducing the strain that child care costs have placed on parents. When policy supports the employment choices of parents with young children, the benefits almost always outweigh the costs in the form of higher earnings, a larger tax base, and better long-term outcomes for children.
Every year, working families in the United States lose out on more than $8 billion in lost wages because they lack access to affordable child care.49 While U.S. female labor force participation has stagnated in the past two decades, most other advanced economies have surpassed the United States by implementing family-friendly policies such as paid parental leave and universal child care and preschool.50
An inclusive, equitable policy agenda should consider maternal labor force participation as a major indicator of short-term and longer-term economic growth. Former Federal Reserve Chair Janet Yellen has quoted a study that estimates that “increasing the female participation rate to that of men would raise our gross domestic product by 5 percent.”51 Social policies that help young families appear to encourage more people to work and may even allow them to be more productive employees.52
That said, universal preschool is not a silver bullet. In fact, it has the potential to affect the supply and cost of child care for infants and toddlers. This has been a challenge in Washington, D.C., where parents face some of the most expensive child care in the country. As the city expands its preschool program, some fear that the public provision of preschool has led to a contraction in the child care market for children ages 0 to 3. Typically, infants are the costliest age group to serve, while preschoolers are the least costly.53 Private child care providers have traditionally cross-subsidized their smaller infant and toddler rooms by serving one or two full classrooms of preschoolers. Without that revenue, some providers may need to increase prices or enroll fewer children.
To address these challenges, the Council of the District of Columbia recently approved Birth-to-Three for All D.C. Act, which pledges almost a half-billion dollars over a decade to cap the amount of a family’s income that goes to child care costs. If signed by Mayor Muriel Bowser (D), starting in 2022 all families in the district will be eligible for child care subsidies that will limit their family contribution to 10 percent or less of their income. This legislation also mandates that additional subsidy dollars are dedicated to increasing the salaries of child care workers so that they are compensated at the same level as preschool and kindergarten teachers.54 Were it to be fully implemented, Washington, D.C., would offer the most comprehensive early childhood education system in the country.
The best possible solution would be a comprehensive approach to providing high-quality child care to all children from birth to age 5 that also addresses after-school care and summer child care. A mixed-delivery system supported by public and private funding can bring together providers from Head Start programs, licensed family and center-based child care providers, public schools, and community-based organizations to provide enough quality child care to meet demand. Collectively, these programs and providers can offer a variety of high-quality child care options to suit the different needs of young families.
Finally, policymakers and analysts need to consider the distribution of benefits that a universal policy such as the District of Columbia’s public preschool program produces. Universal programs may garner strong political support, but this analysis suggests that many of the private benefits have gone to higher-income families in the district. It’s possible that this program has added to the pressures of gentrification, as the incentive structure has changed for higher-income, more educated parents.
As higher-income cities expand preschool in the absence of state or national investments, the benefits of high-quality early learning are aggregating to those communities that can afford it, while most suburban and rural families are left to pay for private child care and preschool. This is one of the reasons that the United States needs a national preschool solution. Where a family lives should not determine whether a child has access to a quality early education. Unfortunately, across most of the country, this is the case. Along with paid family and medical leave, a living wage for all workers, and paid sick days, quality child care and preschool must be part of the progressive agenda to support working parents and their families.
Conclusion
The two years of free, high-quality preschool that Washington, D.C., offers have resulted in the city boasting the highest maternal labor force participation rate in the nation. The District of Columbia’s universal preschool program has been good for significant numbers of women and their families, but it has also made the city an even more attractive place to live for those who can afford its high cost of living.
And because of various factors that drive demographic change and gentrification, increases in the District of Columbia’s maternal labor supply have not all gone to those most in need of more income. Instead, gains have gone to families at both ends of the income spectrum, with those mothers in families at or below the poverty level and those mothers in families earning more than 500 percent of the poverty level experiencing the biggest maternal labor force participation rate increases. In the absence of a national policy solution, many cities are investing more in early learning programs as a way to prepare children for school and to ease the child care burden on working families. The District of Columbia’s ambitious universal preschool program certainly provides strong evidence that two years of free, high-quality child care allows many more women to participate in the labor force.
About the author
Rasheed A. Malik is a senior policy analyst for Early Childhood Policy at the Center for American Progress. His work focuses on child care infrastructure and supply, the economic benefits of child care, and bias and discrimination in early childhood policy. Malik’s research has been cited by NPR, HLN, The Washington Post, Slate, CNNMoney, The Guardian, and Newsweek, among others. Malik holds a master’s degree in public policy from the Gerald R. Ford School of Public Policy at the University of Michigan and a bachelor’s degree in public affairs from Baruch College.
Acknowledgments
The author would like to thank Katie Hamm and Marcella Bombardieri for their helpful edits on drafts of this report, as well as Alex Rowell and Michael Madowitz for their review of code and early findings. The author also thanks the following external reviewers, whose thoughtful and generous feedback was critical to the completion of this report: Randy Albelda, Kate Bahn, Elizabeth Cascio, Chloe Gibbs, Elise Gould, Chris Herbst, Elisabeth Jacobs, Rhonda Sharpe, Aaron Sojourner, Jooyeoun Suh, and Erdal Tekin.
Methodological appendix
Data sources
The findings in this report come from an analysis of the U.S. Census Bureau’s American Community Survey (ACS) public use microdata, downloaded from the Minnesota Population Center’s Integrated Public Use Microdata Series USA database. Census public use microdata include individual ACS response information such as relationship status, sex, educational attainment, and labor force status. The author used the data from these 2005–2016 ACS surveys to produce annual estimates of labor force participation among women who reside with their own child under age 5. Due to the relatively small size of this subpopulation, when possible the author used ACS five-year samples to obtain a large enough sample size. The exceptions are the years 2005 to 2008. This is because the ACS only offers one-year samples for 2005 and 2006 and three-year samples for 2007 and 2008.
To build a large enough pool of donor cities for the synthetic control method analysis, the author used the statistical geographic areas known as Public Use Microdata Areas (PUMAs). PUMAs are the smallest defined geographic areas in census public use microdata and are redrawn every 10 years following the decennial census. These contiguous geographic areas nest within states or the equivalent entity, contain at least 100,000 people, and are built up by census tracts.55 Since urban census tracts are drawn to follow city limits, when possible, all sufficiently large cities can be geographically approximated, sometimes perfectly, using a set of PUMAs. For example, Denver is comprised of five specific PUMAs, and Chicago is comprised of 17 PUMAs. If a city’s population grows or shrinks over time, the Census Bureau redraws the PUMAs after the following head-count census. From 2000 to 2010, Detroit lost two PUMAs to keep the population above 100,000 people in each area.
The author used PUMA-place crosswalk tables and shapefiles from the Minnesota Population Center to isolate the 2000 PUMAs and 2010 PUMAs associated with each of the 50 largest U.S. cities, by population.56 Using ACS public use microdata from 2005 to 2016, the author was able to identify the subpopulations within the ACS microdata by city. The 2000 PUMAs were used with ACS data from 2005 to 2011, and the 2010 PUMAs were used with ACS data from 2012 to 2016. Using this city-identified ACS data, the author produced citylevel estimates of maternal labor force participation (mlfp), average hours worked by women with young children, mlfp by marital status, mlfp by income quintile, mlfp by race/ethnicity, mlfp by educational attainment, maternal racial demographics, maternal educational attainment, average family income among families with young children, the poverty rate among women with young children, and the average age of mothers with young children.
Synthetic control method
The first step in implementing the synthetic control method was to identify a set of predictor variables for a city’s maternal labor force population among women with a child under age 5. Using a multivariate regression analysis, the author identified four variables that are strongly predictive of this maternal labor force participation rate. They are:
- The average number of weekly hours worked by women with young children
- The share of the city’s maternal population with either an associate degree or some college
- The share of the city’s maternal population with a bachelor’s degree or higher
- The poverty rate among a city’s maternal population
These four variables, regressed on maternal labor force participation, explain about 83 percent of the variation in the dependent variable. This relationship is stable across many years in the pretreatment and post-treatment years.
The second step in the synthetic control method is to identify possible donor cities to be used as a synthetic Washington, D.C. Cities that introduced large public preschool programs in either the pretreatment or post-treatment period were excluded from the donor pool. These cities are: Austin, Texas; Jacksonville, Florida; Fort Worth, Texas; New York, New York; Oklahoma City, Oklahoma; Baltimore, Maryland; Milwaukee, Wisconsin; Atlanta, Georgia; Miami, Florida; and Tulsa, Oklahoma. Additionally, New Orleans, Louisiana, was excluded because of the large population shock resulting from Hurricane Katrina. This left 38 possible donor cities.
Using statistical software, the author implemented the synthetic control method using the “Synth” and “synth_runner” packages, which use a regression-based method to select predictor weights and produce a synthetic control entity—in this case, a synthetic Washington, D.C. In addition to the four predictors, the regression model also included three lagged outcome values, as suggested in the synthetic control method literature.57 The combination of weighted cities that most closely resembles Washington, D.C., in the pretreatment years of 2000 to 2008 is the following:
- Kansas City, Missouri (48.1 percent)
- Nashville, Tennessee (30 percent)
- Seattle, Washington (13.7 percent)
- Dallas, Texas (4.3 percent)
- Detroit, Michigan (3.9 percent)
These five cities, averaged together in this specific combination, accurately match Washington, D.C., in terms of the four predictor variables and the outcome variable, maternal labor force participation among women with a child under age five. As shown in Figure 1, the synthetic control closely follows the trend of Washington, D.C., before diverging from the observed change in maternal labor force participation in the years after universal preschool was enacted. The “Synth” package estimates that the effect of the Washington, D.C., preschool policy intervention is 9.9 percentage points by 2016.
The author then used the “synth_runner” package to conduct a placebo test on all cities in the donor pool to determine the significance of the results. Not surprisingly, given the large effect size, this placebo test confirmed that the post-treatment effect is not merely the result of chance.
One of the limitations of this methodology is that city populations can grow and change significantly during a time window of 10-plus years. When the synthetic control method is applied to states or countries, this is less of a concern. However, as shown in Table 2, Washington, D.C., experienced significant growth and demographic changes during the period of this study. The author acknowledges this in the text of the report, understanding that some of the effect may be the result of a kind of selection bias, as more white and affluent families found it easier to afford the costs of living in Washington, D.C.
Difference-in-differences analysis
To verify these findings, the author employed two versions of a difference-in-differences technique to derive estimates of the change in maternal labor force participation and employment among women with a child under age 5. The difference-in-differences technique is a quasi-experimental design that uses longitudinal data from a treatment and control group to estimate a counterfactual outcome for the control group, from which the model estimates a causal effect on the treatment group.
In the first difference-in-differences model, the author used neighboring municipalities in Maryland and Virginia as a control group. The author produced estimates of the maternal labor force participation among just the PUMAs that border the District of Columbia. These PUMAs include the communities of Arlington, Fairfax, Falls Church, and Alexandria on the Virginia side, and Silver Spring, Bethesda, College Park, and much of Prince George’s County on the Maryland side. This model estimates an effect size of 10.3 percentage points, in line with the synthetic control method analysis.
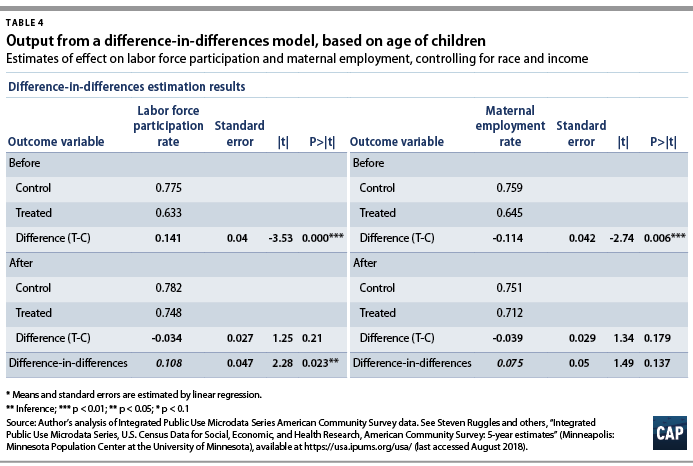
The second difference-in-differences model compares the maternal labor force participation rates for District of Columbia mothers with children under age five, which is the treatment group, against the participation rate for District of Columbia mothers with children between ages 6 and 11, which was the control group. The assumption is that both groups were exposed to the same policy environment, economic conditions, housing market, and so on. Any changes in the difference between labor force participation rates for these two groups can suggest evidence of a causal effect. This model, the output of which is shown in Table 4a, also controls for race, poverty status, and family income. The results suggest a statistically significant 10.8 percentage point effect on maternal labor force participation.
The author also applied this model to maternal employment, as shown in Table 4b. This model estimated a 7.5 percentage point effect, though it is not statistically significant at the 90 percent level of confidence. This model also controls for race, poverty status, and family income.
In an attempt to isolate the labor effect among women with children 3 or 4 years old, the author tried one more identification strategy using the difference-in-differences technique. The population of District of Columbia mothers with young children was split into two groups: 1) those with a child under age 3, which would serve as the control group; and 2) those with a child ages 3 to 5, which would serve as the treatment group.
This approach seems to have suffered from two problems. First, this significantly diminishes the sample size within each category, resulting in imprecise estimates and results that are not statistically meaningful. Second, the fact that the American Community Survey is a continuous measurement system—or a survey that collects data throughout the year—suggests that using precise age cutoffs for control and treatment groups is inappropriate.
Current Population Survey estimates
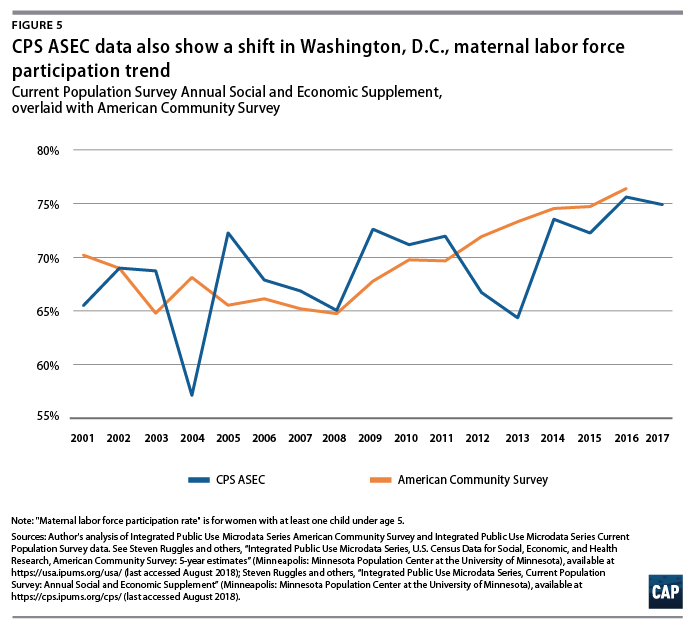
In any analysis of labor force participation, researchers have several options when deciding which survey data to use. In this case, the author uses the annual ACS because of its large sample size, as opposed to the monthly Current Population Survey (CPS), which uses a smaller sample but contains much more detailed information about employment in the annual March supplement. In most cases, however, researchers can check estimates from one survey by looking for the same trend in the other. As shown in Figure 5, the author produced estimates of maternal labor force participation for Washington, D.C., using the CPS, which confirm both the range of estimates and the growth in maternal labor supply in the years following universal preschool expansion. Although the smaller sample size produces noisy estimates, the CPS data seem to line up with the different before and after trends in the ACS estimates of maternal labor force participation, with 2008 as the pivot point. This suggests that there is not any systemic bias in the ACS estimates, as expected.
Concerns about crowd-out of the private market
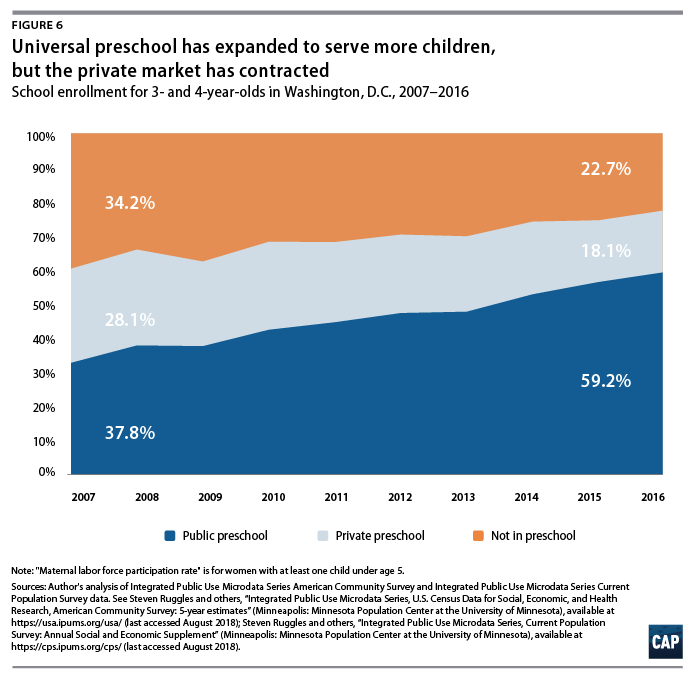
Another issue that can arise from a large expansion of public preschool is the crowding out of the private market for preschool. To test this, the author used census data to verify the enrollment increases reported by the D.C. Office of the State Superintendent of Education, then disaggregated the enrollment numbers by private and public school, on which the ACS collects information for children as young as age 3. As shown in Figure 6, the census data confirm that there was an increase in preschool enrollment over the period considered in this study, from 57 percent of all 3- and 4-year-olds in 2006 to 77 percent of these children in 2016.58 This analysis also finds that enrollment increases in public preschool were three times as large as enrollment decreases in the share of 3- and 4-year-olds attending private preschool. Put another way, it appears that only about one-quarter of the growth in public preschool enrollment comes from families shifting from private to public programs.