Introduction and summary
Almost 92 million eligible Americans did not vote in the 2016 presidential elections.1 In the 2014 midterm elections, an estimated 143 million eligible Americans failed to vote, marking the lowest voter participation in 72 years.2 For the nation’s democracy to function properly and for government to provide fair representation, all eligible Americans must have the opportunity to vote—and be encouraged to do so. Our collective self-rule is established and fostered through free, fair, accessible, and secure elections through which the voice of every eligible American is heard.
The American people recognize the importance of voting in our democracy. In a 2018 Pew Research Center survey, 74 percent of respondents ranked election participation as a very important determinant of good citizenship—above paying taxes and following the law.3 And yet, millions of eligible voters are missing from America’s political decision-making process. This may be because of unnecessary barriers in the voter registration and voting process that prevent would-be voters from casting ballots or because potential voters feel alienated from government. Nationwide, roughly 6 million American citizens are barred from having their voices heard because of antiquated and discriminatory ex-offender disenfranchisement laws. Voter suppression tools, including improper voter purges such as those recently upheld by the U.S. Supreme Court, keep countless eligible Americans from voting each election cycle.4
However, America can build an election system based on pro-voter policies and practices that drive participation by all eligible voters. To do so, first, barriers to registering to vote and to voting must be eliminated, and reforms must be implemented in order to enable all eligible Americans to cast a ballot that will be securely counted. Implementing automatic voter registration (AVR) in all 50 states and the District of Columbia could result in more than 22 million newly registered voters in just the first year of implementation.5 In addition, eliminating ex-offender disenfranchisement laws would bring more than 6 million new voters into the electorate.6 At the same time, civic engagement tools must be designed to encourage voting, particularly for those who have become alienated from the democratic process and do not feel heard by their elected leaders or represented in government.
Implementing automatic voter registration (AVR) in all 50 states and the District of Columbia could result in more than 22 million newly registered voters in just the first year of implementation.
When people exercise their power as voters, they can elect local, state, and national leaders who are responsive to and reflective of the communities they serve. For example, in November 2017, Philadelphia voters translated their desire for criminal justice reform by electing Larry Krasner as the city’s new district attorney with 74 percent of the votes.7 Krasner is a vocal critic of mass incarceration, racial bias, and corruption within the criminal justice system and recently ended cash bail requirements for low-level offenders.8 Voters have also used their power to diversify government bodies and make them more reflective of the broader population, for example, by electing LGBTQ candidates and people of color.9 In one instance, recognizing the important issues at stake in the November 2017 elections—from immigration reform to health care to civil rights—voters in Virginia exercised their power over government at higher rates than in past gubernatorial elections: 47.6 percent in 2017, compared with 43 percent in 2013.10
This report examines the problem of low voter participation in America, which includes structural barriers that keep Americans from having their voices heard as well as widespread disillusionment with the political process. As this report shows, obstacles to voting and distrust in government have repercussions for representational democracy, leading to participation gaps across demographics as well as elected bodies that are unrepresentative of the broader population of American citizens.
To increase voter participation and expand voting opportunities for eligible voters, states have a number of tools available, including those detailed in this report. Taken together, the policies and practices explored in the sections below are proven to increase voter participation and make voting more convenient. The success of these programs depends largely on states’ commitment—as well as that of campaigns and grassroots organizations—to inform eligible voters of their availability, how to use them, and why exercising their power as voters can make a difference in their lives. In addition to analyzing the contributing factors to low voter turnout and the effectiveness of pro-voter policies in increasing participation, this report examines the impact of civics education and voter engagement work.
This report also outlines the following recommendations to drive voter participation and make the process of voting more convenient for eligible Americans:
- Streamline voter registration with automatic voter registration, same-day voter registration (SDR),11 preregistration of 16- and 17-year-olds, and online voter registration
- Make voting more convenient with in-person early voting, no-excuse absentee voting, and vote-at-home with vote centers
- Provide sufficient resources in elections and ensure voting is accessible
- Restore rights for formerly incarcerated people
- Strengthen civics education in schools
- Invest in integrated voter engagement (IVE) and outreach
This report also highlights the success of these policies based on existing literature. Where possible, gains in voter participation were projected using current impact data. Of course, demographics and voting cultures differ across states and even by jurisdiction, so these projections are not exact. However, they do provide an idea of how many of America’s missing voters could be engaged through these policies. There were some policies for which the authors were unable to project gains because key data points were unavailable. For these policies, more research must be done to determine their potential impact on voter participation in future elections. (See Methodology for a more detailed explanation)
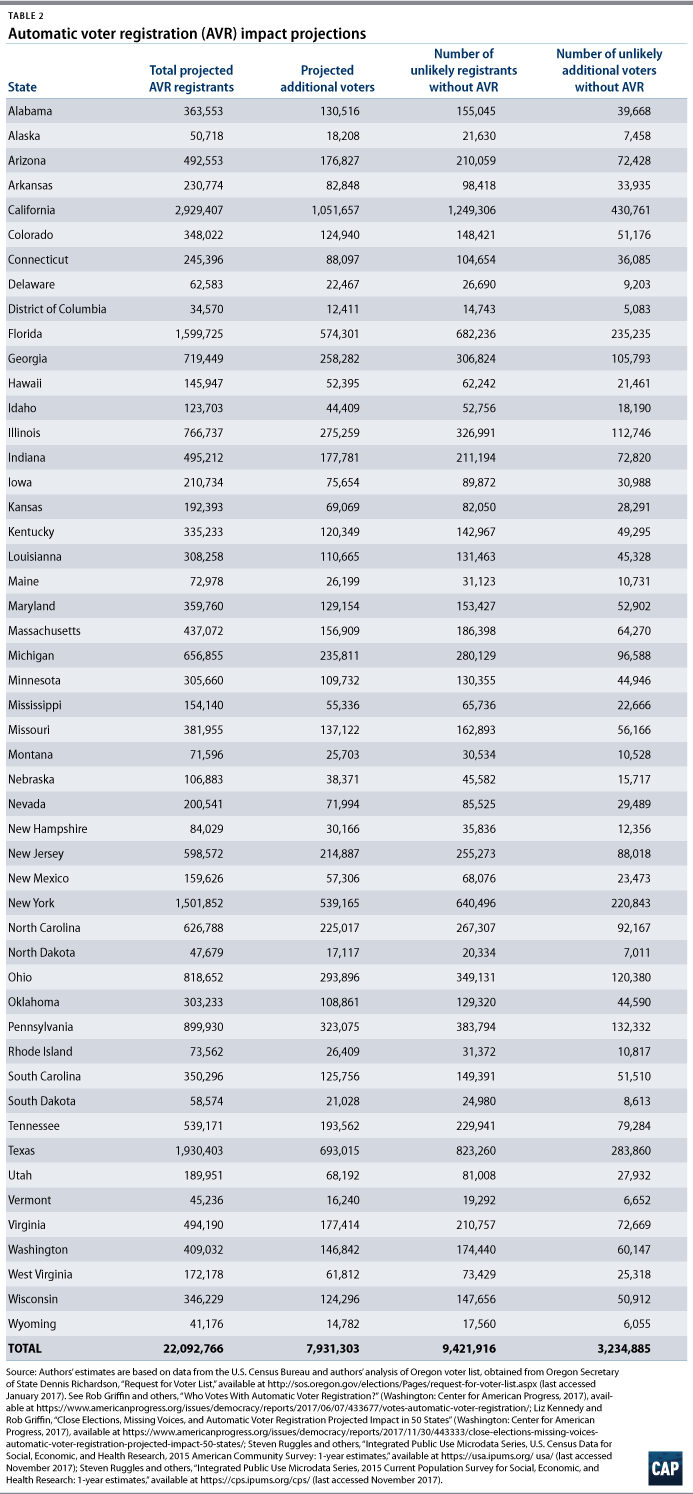
- Automatic voter registration: Center for American Progress research finds that, if every state implemented Oregon’s model of AVR, more than 22 million registered voters could be added to state voter rolls in just the first year.12 Based on this analysis, one could expect more than 7.9 million new voters nationwide—including 3.2 million previously disengaged voters—within just the first year of implementation.
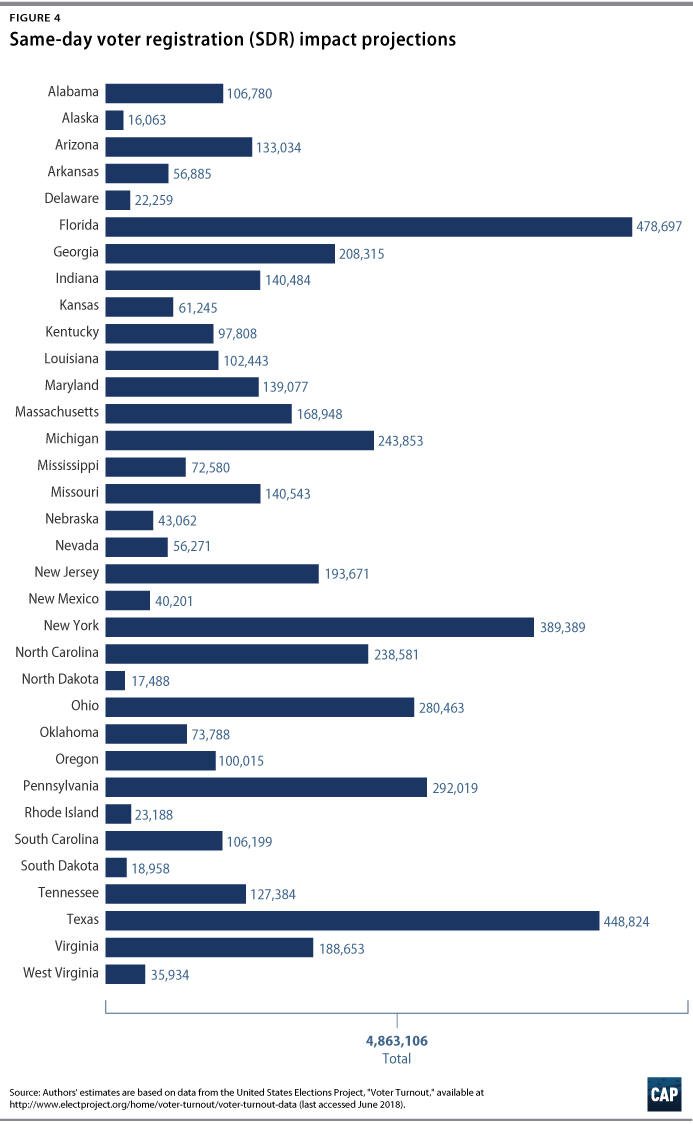
- Same-day voter registration: States with SDR, which this report defines as including Election Day registration, experience, on average, a 5 percent increase in voter participation and consistently have the highest participation in the country.13 According to the authors’ calculations, if all states without SDR had passed and implemented the policy, there could have been approximately 4.8 million more voters in the 2016 elections.
- Preregistration: In Florida, preregistration laws have been found to improve youth voting participation by 4.7 percentage points.14
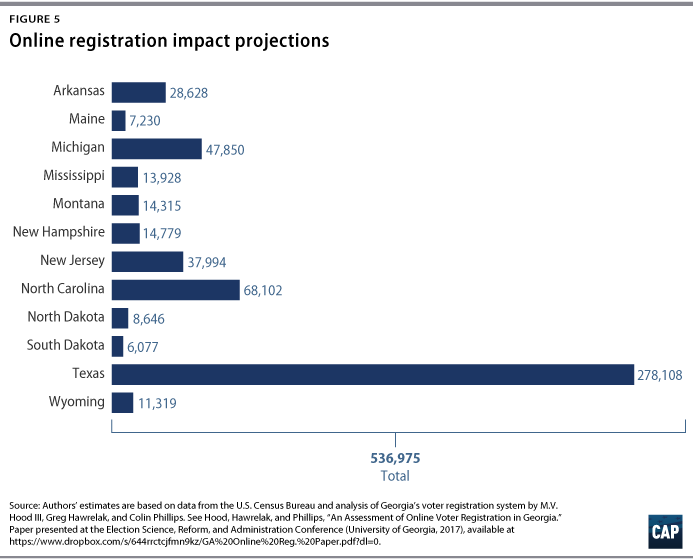
- Online registration: A study of Georgia’s online voter registration system found that approximately 71 percent of those who registered online turned out to vote, compared with 48 percent and 52 percent of those registering by mail or through a state agency, respectively.15 According to the authors’ calculations, had every state implemented an online voter registration policy such as Georgia’s, there could have been more than 536,000 additional voters during the 2016 elections.
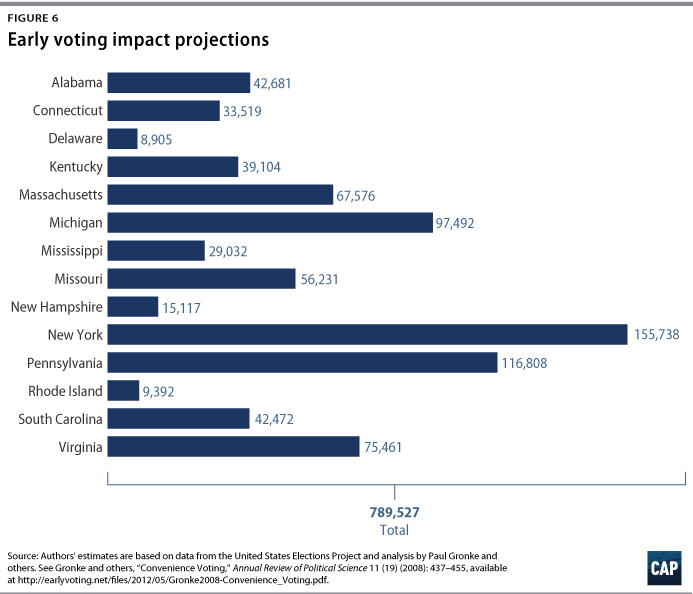
- Early voting: One study found that early voting can increase participation by about 2 to 4 percent.16 Eliminating early voting has also been found to decrease turnout in communities of color.17 According to the authors’ calculations, if all states had early voting in place during the 2016 elections, there could have been at least 789,500 more voters.
- No-excuse absentee voting: No-excuse absentee voting has been projected to increase voter participation by about 3 percent over time.18
- Vote-at-home with vote centers: Colorado’s vote-at-home plus vote centers policy increased voter participation in the state by about 2 to 5 percent and increased participation for young people by 9 percent.19
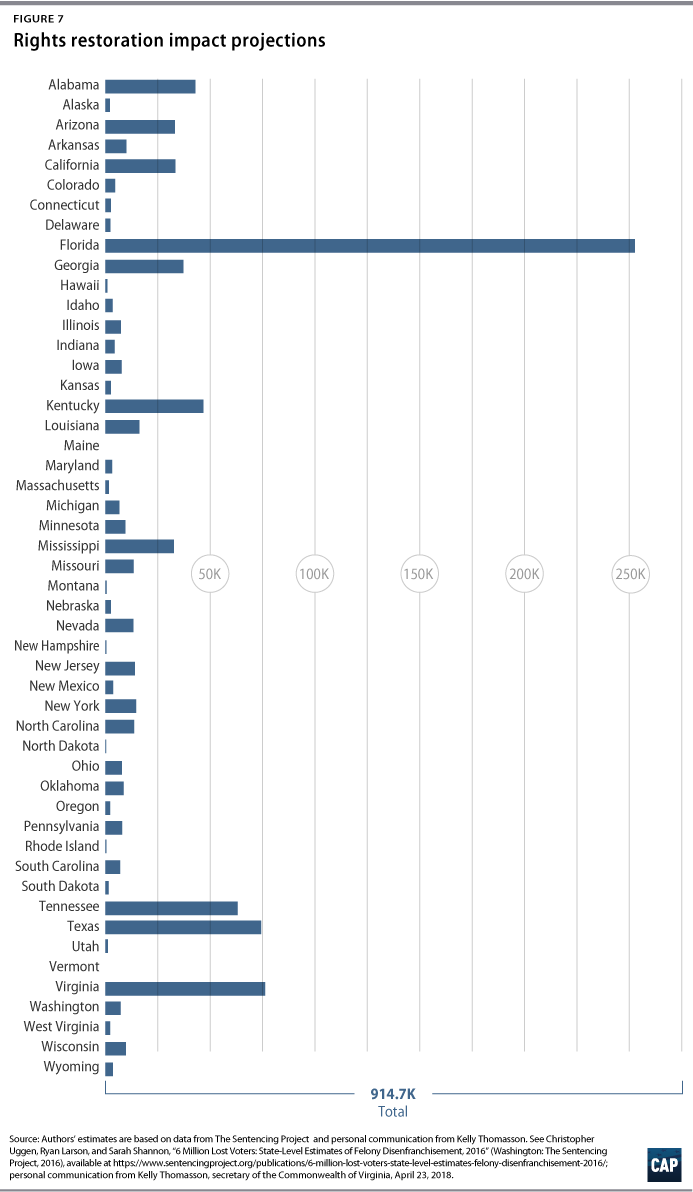
- Restore rights for formerly incarcerated people: More than 25,000 formerly incarcerated people in Virginia participated in the 2016 elections after having their rights restored by former Gov. Terry McAuliffe (D).20 Based on Virginia’s experience, all else being equal, if all formerly incarcerated people had their rights restored, there could have been more than 914,000 additional voters during the 2016 elections.
- Strengthen civics education in schools: As one example, a study of Kids Voting USA—a civics education model—in Kansas found that voter participation was 2.1 percent higher for both 18-year-olds and their parents in Kansas counties that incorporated Kids Voting into school curricula.21
- Invest in integrated voter engagement and outreach: Integrated voter engagement groups combine issue advocacy and organizing with voter mobilization to effectuate positive change within the communities they serve. From 2012 to 2016, the IVE group Emgage, saw a 17.2 percent increase in participation among Muslim American voters. Grassroots voter outreach efforts are also successful in driving participation; one study showed that an additional vote is produced for every 14 people contacted by canvassers.22 According to the authors’ calculations, had every eligible nonvoting American been contacted by canvassers, there could have been approximately 6.2 million more voters during the 2016 elections.
These pro-voter policies are mutually dependent and reinforcing. For example, the effectiveness of more convenient voting options—including early voting, vote-at-home, and no-excuse absentee voting—depends on eligible voters being registered. As aptly described in a report by the director of the Elections Research Center at the University of Wisconsin, Barry C. Burden, and others, “The additional convenience of early voting is worthless to a potential voter who finds that she is actually not registered, and therefore unqualified to vote.”23 At the same time, the benefits of registration modernization cannot be fully realized if voters do not have opportunities to exercise their civic duty. Moreover, these policies often complement each other. Whereas early voting on its own has been shown to increase participation by about 2 to 4 percent, early voting combined with same-day voter registration has increased voter participation by 4.2 to 11 percent where it has been implemented.24
The policies examined in this report—registration modernizations, convenience voting, sufficient resources, and rights restoration—have shown success in increasing voter participation and in making voting more convenient, particularly among historically underrepresented groups. Along with ensuring strong civics education and carrying out robust integrated voter engagement, these policies have the potential to reshape and reinvigorate the electorate. Through them, the 92 million eligible voters who did not vote in the 2016 elections will find or regain their voices, resulting in a more representative and responsive government that works for all Americans.
Status of pro-voter reforms in the states
Recognizing that these policies increase participation and expand the electorate, many states are prioritizing advancement of pro-voter reforms. For example, in 2018, Washington state took significant strides to improve its pro-voter policy structure by enacting a reform package that included automatic voter registration, preregistration for 16- and 17-year-olds, and same-day voter registration.25 CAP estimates that, in Washington, AVR could result in more than 50,000 new voter registrants, 21,000 of whom would be unlikely to register without the program.26 And in April 2018, New York Gov. Andrew Cuomo (D) issued an executive order restoring voting rights to an estimated 36,000 eligible Americans on parole.27
Table 1 lists the states in which each of the pro-voter policy reforms assessed in this report have been adopted—although, in some instances, implementation is still underway.
Voter participation rates and demographic gaps
Millions of eligible Americans today are either choosing not to vote or are prevented from participating in the electoral process. Voter participation remains low by historical measures. Since 2000, voter participation for U.S. citizens has hovered between 54 and 64 percent during presidential elections and between 41 and 48 percent during midterm elections.28 In 2016, falling participation defined the election, as swing states such as Wisconsin and Ohio saw voter participation drop by approximately 3 percent and 4 percent, respectively, compared with 2012.29 Voter participation rates are particularly low during primary and local elections. During the 2016 primaries, only 28.5 percent of eligible voters cast votes for party candidates, while a mere 14.5 percent participated in the 2012 primaries.30 For local mayoral elections, participation falls below 20 percent in 15 of the country’s 30 most populous cities.31
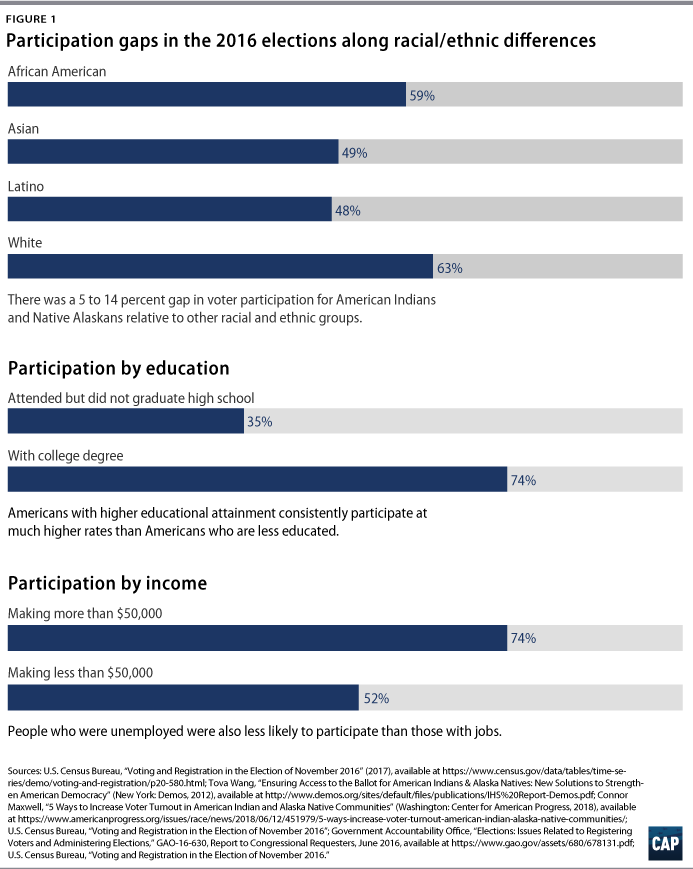
America’s representative government is warped by low voter participation, and, of those who do vote, the group is not representative of the broader population of eligible American citizens. Research shows that communities of color, young people, and low-income Americans are disproportionately burdened by registration barriers, inflexible voting hours, and polling place closures, making it more difficult for these groups to vote. Participation gaps persist along racial, educational, and income-level differences. (see Figure 1)
These participation gaps matter for who we elect and who holds public power. Although the 115th Congress is the most diverse in history, communities of color are still underrepresented.32
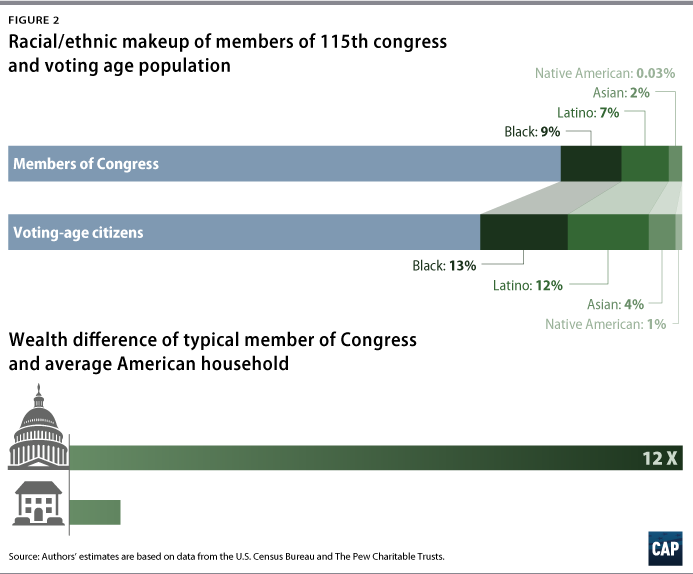
Furthermore, according to a Quartz analysis, the typical member of Congress is at least 12 times wealthier than the average American household.33 Nearly half of all 535 members of Congress have a net worth of at least $1 million, whereas the median net worth for an American adult in 2014 was only about $45,000.34 President Donald Trump’s initial cabinet—which included Rex Tillerson, Tom Price, and Reince Priebus—was worth a combined $9.5 billion, exceeding the combined wealth of more than a third of all U.S. households.35
Eligible voters are clear about the barriers tthat keep them from voting. For example, a 2017 Pew study examined why registered voters refrained from voting in the 2016 elections and found the most common reason among respondents—25 percent—to be that they “Didn’t like candidates or campaign issues,” followed by “Not interested, felt vote wouldn’t make difference,” at 15 percent; “Too busy or conflicting schedule,” 14 percent; “Illness or disability,” 12 percent; “Out of town or away from home,” 8 percent; “Registration problems,” 4 percent; “Forgot to vote,” 3 percent; “Transportation problems,” 3 percent; and “inconvenient hours or polling place,” 2 percent.”36
America’s representative government is warped by low voter participation, and, of those who do vote, the group is not representative of the broader population of eligible American citizens.
There are a number of challenges associated with analyzing the effectiveness of pro-voter policies in boosting voter participation—including diverging research methodologies, uniqueness of state and local policy models, and difficulty distinguishing between correlation and causation in election settings. However, the policies discussed in this report have been shown to improve voter participation and help make the process of voting more convenient by eliminating many of the barriers keeping millions of Americans from exercising their civic duty.37 Additionally, strong civics education and integrated voter engagement programs can help to address widespread alienation by connecting voting to the issues that affect people’s lives, by demystifying government, and by educating people on the electoral process and inviting them to participate. If properly implemented, these policies and practices have the potential to expand the electorate and to elect representatives that are more reflective of and responsive to the American population.
The utility and impact of the pro-voter structural policies described in this report depend largely on people knowing that they exist and how to use them. As described by voting expert Tova Wang:
“For election reforms to work, people have to know about them. People don’t even know about the options available to them. They need to be provided with this information in very simple straightforward terms.”38
Infrequent or first-time voters are especially unlikely to know about the availability of things such as same-day voter registration and early voting. This obligation falls largely on states and localities, both of which should send eligible voters notifications regarding voting registration deadlines and information about eligibility as well as where and how to register. Well in advance of Election Day, eligible voters should receive notifications that remind them to vote and include information about their respective polling place and voting hours. This would help cut down on improperly cast ballots.39 Distributing sample ballots can also help to improve the voting experience and reduce wait times at polling places.40 One study found that, during the 2000 elections, participation was 2.5 percent higher in states that mailed information about polling places to voters in advance and 2 percentage points higher in states that mailed sample ballots.41 The effects were especially notable for voters with little education and for young people.42 In the seven states that mailed sample ballots, voter participation for registered youths was 73 percent, compared with 67.3 percent in states that did not distribute sample ballots.43
How to increase voter participation and make voting more convenient
The sections that follow describe pro-voter tools that states can adopt in order to increase voter participation and provide more voting opportunities for eligible Americans. By adopting the following recommendations, states can diversify and expand the electorate, resulting in a government that is more representative of the American populace and in policy outcomes that better reflect public will.
Streamline voter registration
One of the most effective ways to improve voter participation is to increase the number of people who are registered to vote by making the process more convenient. Every state except North Dakota requires that people register to vote before casting their ballot.44 Yet there are still millions of Americans who are unregistered; according to the U.S. Census Bureau, in 2016, approximately 1 in 7 American citizens who were of voting age self-reported that they were not registered to vote.45 In 2012, Pew estimated that nearly 1 in 4 eligible Americans were unregistered.46
In 2016, approximately 1 in 7 American citizens who were of voting age self-reported that they were not registered to vote.
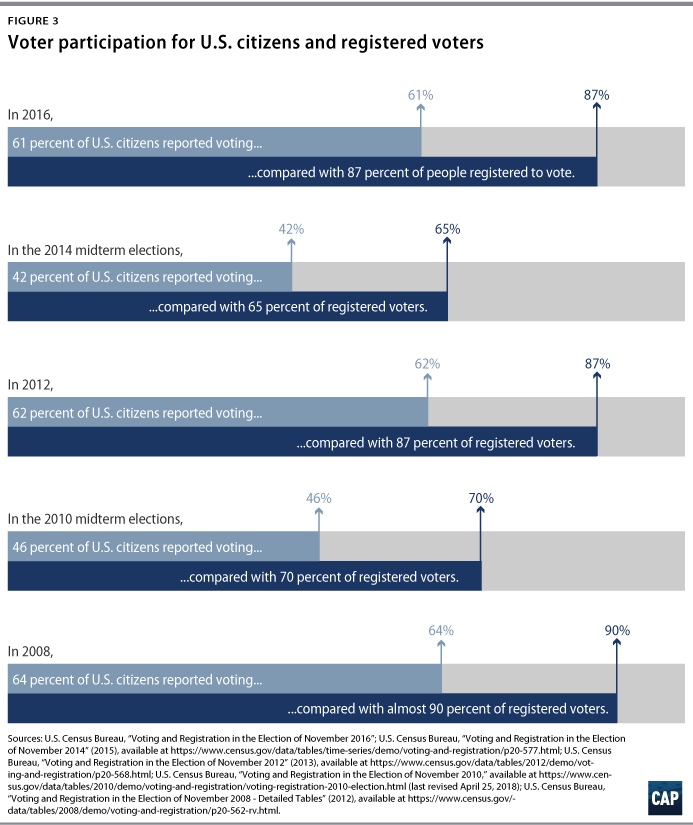
Simply registering more people to vote would increase participation, as registered individuals are more likely to cast a ballot in elections. For example, in 2016, 61 percent of U.S. citizens reported voting, compared with 87 percent of people registered to vote.
Each election cycle, barriers to the voter registration process—including a lack of accessible information about where and how to register—prevent countless Americans from voting. In a 2017 survey, 6 percent of respondents said that they were not registered to vote because they did not know how to register.47 Meanwhile, a 2018 report found that, in Arizona, New Mexico, Nevada, and South Dakota, Native Americans most commonly fail to register to vote because they do not know where or how to register and because they miss the voter registration deadline.48 In 2014, 1.9 million people failed to register because they did not know where to register or how to do so.49
Certain groups are less likely to be registered to vote; these include communities of color, low-income Americans, those with disabilities, and young people.50 In 2016, 69 percent of black and 57 percent of Hispanic Americans were registered to vote, compared with 72 percent of whites.51 Asian Americans were 16 percent less likely to be registered to vote than whites.52 Furthermore, in 2012, only 66 percent of American Indians and Alaska Natives were registered—7 percentage points lower than their white counterparts.53 A shocking 20-point gap exists in registration rates between Americans making less than $25,000 per year and individuals making $100,000 or more per year.54 Eligible Americans with disabilities are also less likely to be registered to vote—by about 2 percentage points—than people without disabilities.55 And in 2012, 735,000 potential voters were prevented from having their names added to the voter rolls because of language barriers in the registration process.56
Young people are particularly burdened by barriers in the voter registration process. According to the census, people ages 18 to 34 were registered at a rate of 64 percent in 2016, compared with 72 percent of citizens 35 years or older.57 In 2012, 18- to 29-year-old nonvoters most commonly cited “not being registered” as their reason for not voting.58 In all, 55 percent of black youth, 45 percent of Latino youth, and 61 percent of white youth reported “not being registered” as the reason that they did not cast ballots in the 2012 election.
Improving the voter registration process can decrease gaps in voter participation between demographic groups. For example, in 2016, white voting-age citizens participated at a 63 percent rate, while voting-age citizens of color participated at a 53 percent rate.59 However, the participation gap decreases significantly between registered whites and registered people of color: 87.78 percent versus 84.91 percent, respectively. Therefore, while the participation gap between eligible white citizens and eligible citizens of color is 10 percentage points, among registered citizens, the gap is only 2.87 percentage points.60
Even if one succeeds in navigating the labyrinthine voter registration process, for the millions of Americans who move frequently or lack traditional addresses, registration can be difficult to maintain. From 2016 to 2017, approximately 11 percent of people changed their place of residence. Here, too, there are demographic disparities.61 According to the U.S. Census Bureau, from 2016 to 2017, the black or African American population had a higher moving rate than any other racial or ethnic group; Americans between the ages of 18 and 34 changed addresses more than three times as often as Americans age 35 and older; and those living below the poverty line were about 6 percentage points more likely to move than those living above the poverty line.62
Additionally, arbitrary voter registration deadlines that occur needlessly early make the voter registration process even more difficult for eligible voters. In 2014, arbitrary voter registration deadlines prevented 4.1 million Americans from registering to vote.63 In 2016, 23 percent of voting-eligible but unregistered 18- and 19-year-olds reported having missed their registration deadlines. And, according to a 2012 CIRCLE poll, only 13 percent of young voters knew their state’s voter registration deadline, while a shocking 87 percent did not know their state’s deadline or were misinformed.64 By analyzing the number of Google searches for voter registration deadlines that occurred after state voter registration deadlines had passed in 2012, another report found that an additional 3 million to 4 million Americans would have registered to vote in that election were it not for voter registration deadlines.65 In a recent example, Eric and Ivanka Trump were unable to vote for their father, then-candidate Donald Trump, in the 2016 primaries because they missed the voter registration deadline.66 Courts are beginning to recognize these deadlines’ dangerous effects on the electorate. For example, In 2017, a superior court struck down Massachusetts’ arbitrary 20-day voter registration deadline after finding that it was an unconstitutional burden on the right to vote. The case was heard by the Massachusetts Supreme Court in May 2018.67
To ensure voter registration rolls are accurate and regularly updated, states should enlist the help of the Electronic Registration Information Center (ERIC).68 ERIC uses advanced technology and information to identify voter registrations that are outdated or invalid; this includes names, addresses, birthdates, and other points of comparison through official data from voter registration rolls, motor vehicle records, postal addresses, and Social Security death records.69 Upon receiving ERIC’s results, states contact residents identified by the program as eligible but unregistered to vote in order to educate them on the most efficient means of completing their voter registration. For those whose registration information is identified by the report as inaccurate or outdated, the state provides them with information on how to update their record.70 Through ERIC, states improve the accuracy of voting rolls and identify new eligible residents in order to facilitate their registration.
To streamline voter registration, states should implement the following pro-voter policies, all of which have been shown to increase voter participation and make it more convenient to get registered and keep one’s registration up-to-date:
- Automatic voter registration
- Same-day voter registration
- Preregistration of 16- and 17-year-olds
- Online voter registration
Automatic voter registration
AVR encourages voter participation by realigning incentives and shifting the burden of voter registration onto the state.71 Through AVR, eligible citizens are automatically registered to vote using voter eligibility information that the state already receives—unless the individual chooses to decline registration. One of the major benefits of AVR is that voters’ registrations follow them and are updated automatically if and when they move. In this way, AVR offers a secure, modern way to use data efficiently to enhance the integrity of voter rolls and facilitate voter participation for all.
Oregon’s AVR system, implemented in 2016, registers eligible voters through records received by the Department of Motor Vehicles (DMV), whose applications for a driver’s license, learner’s permit, and identification card require all information necessary to determine eligibility to vote in general elections.72 When Oregonians provide their name, address, birthdate, and citizenship information to the DMV, the agency automatically transmits the information to the elections division in the office of the secretary of state. Once the Oregon State Elections Division receives qualifying voter records from the DMV, it sends postcards to each individual informing them that they will be registered to vote through AVR unless they decline by signing and mailing back the postcard. The individual has 21 days to return the postcard indicating that they do not wish to be automatically registered to vote; afterward, they will be registered to vote upon confirmation of eligibility.73 Voter registrations are automatically updated and confirmed when information about the voter registrant—for example, an updated address—is received by the post office and shared with the secretary of state.74
CAP’s original research found that Oregon’s AVR system increased voter registration rates and expanded the electorate in the state. More than 272,000 new people were added to Oregon’s voter rolls through AVR, and more than 98,000 of them voted in the November 2016 presidential election.75 Another 260,000 voters had their addresses updated through AVR.76 More than 116,000 of those who became registered were unlikely to have done so otherwise.77 As a result of AVR, Oregon’s electorate is now more representative of the state’s population, as citizens registered through the program are younger, more rural, lower-income, and more ethnically diverse.78
Due to the many benefits that automatic voter registration offers election administrators and eligible voters, AVR programs are being adopted across the country. In 2018, three states—Washington, Maryland, and New Jersey—have already adopted AVR. These states followed on the heels of Rhode Island and Illinois, both of which enacted AVR in 2017, and Alaska, whose voters adopted AVR at the ballot in 2016. And beginning in 2018, California will become the second state after Oregon to implement AVR. According to the National Conference of State Legislatures, AVR has been passed by 12 states and the District of Columbia, with varying processes and implementation models.79
Oregon’s experience provides a road map to project how voter registration and participation could increase if each state adopted AVR. For example, roughly one-third of the 272,702 individuals registered to vote through AVR within the first year of its implementation in Oregon voted in the 2016 election. Similarly, of those registered, some 42.5 percent, or 116,000, were unlikely to have registered without AVR, and approximately one-third of the 40,000 previously disengaged people turned out to vote. CAP research finds that, if every state implemented AVR, more than 22 million registered voters could be added to state voter rolls in just the first year. All else being equal, if every state adopted the Oregon model of AVR, within just the first year of implementation, one could expect more than 7.9 million new voters nationwide—including 3.2 million previously disengaged voters.
In adopting AVR, states should abide by Oregon’s postal notification opt-out system, whereby eligible voters receive a notice of their right, via mail, to decline automatic registration. This model is structured to include as many eligible Americans as possible and is the best option for voters in states that are equipped with databases that are secure and efficient. Additionally, states should ensure that designated AVR agencies extend beyond state DMVs to include social services agencies, universities, and departments of correction, where they are technologically prepared to collect and share information to confirm voter eligibility. Doing so will help guarantee that AVR has the greatest impact on the largest number of eligible voters.
Same-day voter registration
Same-day registration, which this report defines as including Election Day registration, improves the voter registration process by allowing registration to take place at the same time that voters are casting their ballots, removing barriers such as arbitrarily early registration deadlines.80 Relatedly, SDR eliminates confusion around where to register to vote, as voters may register at the polling place or other designated locations that permit voting. Moreover, individuals who have moved can simply bring a bill or other documentation showing residency to the designated voting location in order to update their voter registration. In the 2016 election, nationwide, more than 1.2 million voter registrations took place on voting days.81
In the 2016 election, nationwide, more than 1.2 million voter registrations took place on voting days.
Same-day voter registration has proven effective in increasing voter participation.82 States implementing SDR have seen increases in voter participation of between 3 and 7 percent, with an average of 5 percent.83 Furthermore, in states with SDR during the 2012 election, voter participation was, on average, more than 10 percent higher than in other states.84 The three states with the highest voter participation in the 2014 midterms—Maine, Wisconsin, and Colorado—all allow SDR, while 6 of the 7 states with the highest voter participation in the 2012 elections allowed SDR.85 Minnesota, which has led the country in voter participation for the last two presidential elections, has same-day registration, with more than 17 percent of voters having registered to vote through the SDR process during the 2012 elections.86 A 2002 study by the Caltech/MIT Project found that, during the 2000 election, voter participation in states with SDR was 8 percent higher than in states without the policy.87
Notably, same-day registration is effective at increasing voter registration for historically underrepresented groups. In the lead-up to the 2012 elections, nearly 250,000 North Carolinians—41 percent of whom were African American—registered to vote through the state’s then-SDR system.88 Young people also benefit from same-day registration. In 2008, young people from states with SDR policies were, on average, 9 percent more likely to vote than those living in states that lacked the policy.89
According to estimates, if implemented nationally, SDR could boost participation for young people—ages 18 to 25—by 12 percent as well as by 7.5 percent and 11 percent for African Americans and Latinos, respectively.90
In addition to increasing participation, the majority of election officials in jurisdictions with SDR have found implementation costs to be minimal, and roughly half of respondents said that it reduced the burden of voter registration surges that occur before traditional registration deadlines.91
All else being equal, if projections are based on the 5-percent average increase in voter turnout that was experienced by states with SDR, had all states that do not have SDR passed and implemented the policy, there likely could have been more than 4.8 million additional voters in the 2016 elections.
Same-day voter registration is a common-sense policy proven to increase voter participation and close participation gaps. According to the National Conference of State Legislatures, 16 states and the District of Columbia currently offer SDR, including election day registration.92 Two additional states—Maryland and North Carolina—permit SDR, but only during early voting periods. States enacting it must be sure that the policy includes Election Day registration, as opposed to only allowing SDR during early voting periods. To ensure that the policy is carried out effectively, voting locations must be adequately staffed to handle large numbers of same-day registrations, as the policy has proven popular in the states that use it.
Preregistration of 16- and 17-year-olds
One way to improve voter participation for young people is to welcome them into the democratic process early, preregistering them to vote at a time when they are more likely to begin interacting with government agencies where voter registration services are offered. One benefit of this is that, once a person registers to vote, that individual becomes part of a state’s voter file and is more likely to be contacted by campaign and grassroots efforts, which increase voter participation.93
Preregistration policies allow eligible Americans to preregister to vote before their 18th birthday. Upon turning 18, their voter registration is automatically activated so that they can exercise their right to vote. Some states permit 16-years-olds to preregister to vote, while others allow preregistration beginning on an individual’s 17th birthday.94 In Florida, those who preregistered to vote were roughly 4.7 percent more likely to participate in the 2008 elections, compared with those who registered upon turning 18.95 Additionally, preregistration policies can help to narrow participation gaps across certain demographic groups. During the 2008 elections, African Americans who preregistered to vote in Florida were 5.2 percent more likely to vote than those who registered only after turning 18.96
According to the National Conference of State Legislatures, today, 17 states and the District of Columbia permit eligible 16- and/or 17-year-olds to preregister to vote.97 California’s preregistration program is already a rousing success. Since launching its program in the fall of 2016, the state has already preregistered 100,000 16- and 17-year-olds.98
In adopting preregistration policies, states should offer preregistration services through not just the DMV, but other sites and services that are frequented and used by young people, such as schools, hair salons, movie theaters, community days of action, volunteer programs geared toward young people, and naturalization ceremonies.99 Preregistration programs that target 16-year-olds tend to be more effective than those that target 17-year-olds since the former age group is beginning to interact with government agencies for the first time—particularly the DMV. States without preregistration keep young people from using a common method of voter registration until they reach their early- to mid-20s, given that state driver’s licenses can take several years to expire before renewal is required.
Online voter registration
Online voter registration makes the voter registration process more convenient and drives voter participation, particularly for young people. It eliminates the hassle of locating where to register, securing time off work, and finding transportation to DMVs or other voter registration locations in order to register in person. Online voter registration is particularly useful for eligible voters who are highly transient as well as those with inflexible schedules.
Online voter registration is popular in jurisdictions that have it. An analysis of Georgia’s online voter registration program found that, from April 2014 through October 2016, more than 350,000 of the state’s voter registrations were carried out online.100 People ages 18 to 34 made up 70 percent of online registrations, while 42.2 percent of online registrants were registering for the first time.101 Nationally, online voter registration accounted for 17.4 percent of all voter registration in 2016.102
Research shows that those who register online are more likely to participate in elections. The study of Georgia’s online voter registration system, for example, found that approximately 71 percent of those who registered online turned out to vote, compared with 48 percent and 52 percent of those registering by mail and through a state agency, respectively.103 Similarly, a study of California’s online voter registration system found that people registering online were almost 8 percentage points more likely to participate in the 2012 elections than those registering through other more traditional means.104 In addition, 78 percent of California’s online registrants ages 25 to 34 turned out to vote in the 2012 general election, compared with 56 percent of individuals in the same age group who registered through other methods.105 Likewise, in Arizona, online registrants turn out in greater numbers than those who register in more traditional ways; in 2008, those who registered online were 9 percent more likely to participate in that year’s elections, compared with those who registered in other ways.106
All else being equal, if states without online voter registration were to have implemented a policy such as Georgia’s in 2016, a total of more than 536,000 additional voters could have been expected to participate in that year’s elections.
It is likely that the popularity of online voter registration with young people in particular is due, at least in part, to that group’s familiarity with the internet. And, as new generations become more accustomed to using web-based services, reliance on online voter registration may increase in the future.
In addition to improving participation in elections—particularly for young people—online voter registration has been shown to save jurisdictions money. In 2012, California saved nearly $2 million as a result of online voter registration, and between 2008 and 2012, Maricopa County, Arizona, saved almost $1.4 million due to online voter registration.107 Cost savings can derive from reductions in local government costs from producing paper voter registration forms, in the number of poll workers needed to process registrations, and in individual registration costs.108
A study of California’s online voter registration system found that people registering online were almost 8 percentage points more likely to participate in the 2012 elections than those registering through other more traditional means.
According to the National Conference of State Legislatures, 38 states and the District of Columbia currently provide eligible voters with the option to register to vote online.109 When adopting online voter registration systems, states must retain adequate resources and locations, allowing eligible voters to register in person or by mail, if they prefer. As of 2018, 11 percent of all Americans still do not use the internet. Most non-internet users are older, lower-income, and live in rural communities.110 A 2013 study by Pew found that nearly one-third of non-internet users believe that the internet is too difficult to use, while 19 percent cited the expense of internet services or computer ownership as the reason they do not go online.111 Although internet usage is on the rise, it is important to remember that many voting-eligible Americans do not have access to or choose not to utilize online services. As such, to ensure that they are not shut out of the democratic process, they must be provided opportunities to register through other means.
Jurisdictions must adhere to the National Voter Registration Act
In addition to implementing those policies mentioned above, states must meet their obligations under the National Voter Registration Act (NVRA), which requires DMVs, social service agencies, and other government offices to offer voter registration services to eligible people during transactions.112 The NVRA, which was passed in 1992 in order to improve voter registration nationwide, also requires states to accept voter registration forms by mail. In just its first year of implementation, the NVRA helped facilitate voter registration applications and updates for more than 30 million people.113 The popularity of registering through methods authorized by the NVRA continues today: Between 2014 and the 2016 election, more than 25 million voter registrations were received through DMVs, making up 32.7 percent of all voter registration applications during that period.114 As noted by Demos, the NVRA has been particularly beneficial for low-income Americans. In 1992, when the NVRA was enacted, only 43.5 percent of the lowest-income Americans were registered to vote.115 By 2012, 52.7 percent of this group was registered to vote. One study found that the NVRA’s motor-voter provision has helped increase voter participation by between 4.7 and 8.7 percent.116
Unfortunately, in some places, compliance with the NVRA is lacking. A 2017 Pew survey found that only 16 percent of unregistered respondents were asked to register to vote by an official at a motor vehicle department, social services agency, or other government office.117 A 2016 study found that 12 states failed to include the option to register to vote on driver’s license change-of-address applications.118 And a survey of Native American interactions with NVRA agencies found that only 29 percent of respondents from New Mexico reported being asked about voter registration at DMVs or social service agencies.119 Advocates have also raised concerns about the lack of voter registration services at state agencies that provide services to Americans with disabilities.120
Make voting more convenient
Fourteen percent of registered voters cited being “Too busy or conflicting schedule” as their reason for not voting in the 2016 elections, while 2 percent cited “Inconvenient hours or polling place.”121 Although most states have rules in place allowing employees to take time away from work in order to vote on Election Day, many eligible voters still are unable to do so on one Tuesday in November.122 The same is true for Americans with family obligations. Many eligible voters with young children must find reliable and affordable child care before going to the polls. However, this can be especially difficult if designated polling places are located far away or if polling place lines are long, requiring additional time away from work or home—time that many Americans cannot afford. In 2012, voting lines were estimated to have cost Americans $544 million in lost productivity and wages.123 These burdens often fall disproportionately on communities of color and low-income Americans. Black voters are, on average, forced to wait in line nearly twice as long as white voters.124 And long wait times can play a role in dissuading would-be voters from participating in future elections.125
Eligible voters should be provided ample opportunity to exercise their civic duty and have their voice heard in our democracy. Affirmative voting policies—including in-person early voting, no-excuse absentee voting, and vote-at-home with vote centers—aim to make the voting process more convenient for voters, particularly for those with scheduling and transportation challenges. Some convenience-based voting policies, like vote-at-home, have shown to be more effective in driving participation than others.126 And while the effects of early voting and no-excuse absentee voting on participation are less clear, these policies have an important role to play in improving the voting experience by helping to ensure that voters who want to participate in elections have the opportunities to do so.
States should implement the following pro-voter policies in order to expand voting opportunities for eligible Americans and drive participation:
- In-person early voting
- No-excuse absentee voting
- Vote-at-home with vote centers
In-person early voting
Early voting aims to make voting more convenient for eligible voters by providing them with greater flexibility and opportunities to cast ballots. If implemented correctly and with sufficient resources, early voting has the potential to facilitate shorter lines on Election Day—particularly among communities of color—and to improve the voter experience.127 At least 42 million people voted early in the 2016 elections.128 Early voting that takes places on Sundays and “Souls to the Polls” events is particularly popular among communities of color.129 In 2016, at least 52,000 voters took advantage of Georgia’s Sunday voting hours.130
Although some research suggests that, by simply making the task more convenient, early voting mostly benefits people who would already vote, one study found that early voting can increase participation by about 2 to 4 percent.131 When combined with SDR and Election Day registration, early voting can increase voter participation by 4.2 to 11 percent.132 In a 2018 survey of more than 900 voters in New York, 79 percent of respondents said that they would be more likely to vote if the state offered early voting.133
It is also worth noting that cuts to early voting can have a detrimental impact on voter participation. A 2016 study by The Atlantic found that, in North Carolina counties with polling place closures and reductions in voting hours, during the first week of early voting, black voter participation reached only 60 percent of the cumulative participation at the same point in 2012. And while participation increased some in the weeks leading up to the election, black participation never reached more than 90 percent of the cumulative participation in 2012.134 At the same time, in 2012, after the Florida Legislature cut the state’s early voting period from 14 days to 8 days and eliminated voting on the last Sunday before Election Day, early voting participation for African Americans dropped by 4.1 percent relative to 2008, while participation for Latinos dropped by 4.6 percent.135
All else being equal, if states that currently do not have early voting had it in place during the 2016 elections, one could have expected at least 789,500 more voters that year based on conservative 2 percent estimates.
According to the National Conference of State Legislatures, early voting is permitted in 33 states and the District of Columbia, though early voting opportunities vary in terms of timing and location.136 And, although more research is needed on its overall effectiveness at increasing participation, early voting could prove powerful when combined with active mobilization efforts. Even if the policy’s impact on participation is relatively small, during a time when margins of victory are so close that elections are decided by lot, every vote counts.137
In implementing this policy, states should ensure that there is an adequate number of early voting locations conveniently located near public transportation. Early voting should be available on Saturdays and Sundays and should begin at least 14 days prior to Election Day, as research suggests that early voting is most commonly utilized by infrequent voters and nearer to an election.138 Furthermore, states that already have early voting should not reduce or eliminate the policy since reductions of early voting have been shown to decrease participation in communities of color. When adopting early voting, states should avoid reducing the number of Election Day polling places, as doing so may result in long lines and may nullify some of early voting’s benefits.139 Relatedly, states must ensure sufficient polling place hours in order to allow people opportunities to vote.140 Today, most states require voting locations to be open for at least 12 hours. However, hours of operation vary significantly depending on the jurisdiction. Limited polling place hours can be problematic for voters whose workdays begin especially early and end late in the evening and for those who are unable to take time away from work.
No-excuse absentee voting and vote-at-home with vote centers
“No-excuse absentee” and “vote-at-home” are two affirmative voting policies that can make the process of voting more convenient. As noted in previous sections of this report, the act of voting can be a burdensome process for many eligible Americans who otherwise want to participate. It may involve taking time away from work, child care costs, and mobility and transportation challenges as well as long lines and complications at polling places. No-excuse absentee voting and vote-at-home policies help voters avoid these altogether, allowing eligible voters to cast ballots at their convenience, often in the comfort of their own homes.
Absentee voting is the process whereby eligible voters are permitted to return, by mail or in person, voted paper ballots prior to an election. Voters are typically required to fill out an application online or by mail in order to receive an absentee paper ballot from designated election authorities. No-excuse absentee voting is particularly useful for students, those with conflicting work schedules, and those who travel frequently and are otherwise unable to vote in person on Election Day. Whereas some states allow voters to vote absentee only if they are permanently disabled, serve overseas, or live in certain rural areas, 27 states and the District of Columbia allow no-excuse absentee voting, which allows eligible voters to vote absentee for any reason.141 According to one study, states with no-excuse absentee voting experience increases in voter participation of about 3 percent over time.142
In adopting or updating absentee voting policies, states should allow any eligible voter to vote absentee for any reason whatsoever, no excuse needed. This would ensure that all eligible Americans could cast their votes no matter what, even if they were simply out of town or unable to make it to the polls on Election Day but did not fit under one of the limited set of exemptions.
Vote-at-home, which is sometimes called “vote-by-mail,” is another convenience-based voting policy that improves the voting experience and can increase voter participation. Two states—Washington and Oregon—conduct all elections through vote-at-home, while Colorado has an exemplary model that combines vote-at-home with community vote centers where people can still cast their ballots in person.143 Vote-at-home differs from no-excuse absentee voting in that registered voters need not file a request to receive their ballots; ahead of election day, paper ballots are distributed by mail to all registered voters. Voters can take their time examining and researching the candidates and issues, and they can vote in the comfort of their own home before placing their voted ballot in the mail or dropping it off at a vote center or collection box.
How does Colorado’s vote-at-home with vote centers model work?
Colorado is revolutionizing election administration by putting voters first and giving them more opportunities to become registered and vote. Colorado is a vote-at-home state but operates under a model that provides voters many options to cast their ballots. Once voters receive their ballot, which is sent to them automatically by the state, they can:
- Vote by returning the ballot by mail
- Vote by dropping the ballot in one of the conveniently located 24-hour drop boxes located across their county
- Vote by dropping off the ballot or voting in person at a county vote center, where eligible voters can register at the same time as voting
- In the city of Denver, vote by dropping a ballot off or vote in person at the city’s mobile vote center, which travels to different communities within the city.144
Colorado’s model increased voter participation in the state by about 2 to 5 percent, according to one study.145 Notably, after the state implemented vote-at-home, participation increased by 9 percent for Coloradans ages 18 to 34.146 Meanwhile, after Denver implemented its vote-at-home program in 2001, it experienced a significant increase in voter participation among Latinos.147 While the city as a whole saw participation increase by 17.2 percent compared with the 1999 local elections, the 19 precincts with the highest Latino populations experienced an increase of 55.5 percent, and the precinct with the highest Latino population saw participation rise by 82 percent.148 One of the reasons that Colorado’s model is so successful is that it works in tandem with the state’s same-day registration policy.149 By combining these two policies, Colorado has removed significant barriers to registration and provided more options for voting, thus driving participation.
Colorado’s vote-at-home system is unique because of its expansive incorporation of vote centers, which are required statewide and open on Election Day. Colorado vote centers are open Monday through Saturday, for 15 days during general elections and 8 days in primary and off-year elections. Vote centers are conveniently located within and across counties; their precise location is determined through a public selection process whereby the public can provide feedback on proposed locations, including concerns over accessibility and convenience. In Denver, the city’s Ballot TRACE program allows voters returning voted ballots by mail to track their delivery to and receipt by election officials. Voters who sign up for this free service receive regular updates—via email, text message, or an online portal—about the status of their ballot as well as when it is delivered to the elections division.150 In designing the city’s elections, Denver Elections Director Amber McReynolds focuses on the voter experience: “We have a voter-centered approach to election administration—one that respects voters and focuses on improving their voter experience.”151 The state’s prioritization of voters’ needs and convenience has paid off: In 2016, voter participation in Colorado was more than 12 percentage points higher than nationwide turnout.152
During the 2016 elections, voter participation in states allowing vote-at-home was 10 percentage points higher, on average, than it was in other states. However, research has been mixed regarding vote-at-home’s effectiveness at increasing voter participation. A 2017 analysis of vote-at-home’s impact on some California counties found that participation in general elections was lower in jurisdictions using vote-at-home.153 The authors of that study, Thad Kousser and Megan Mullin, posited that, during general elections, when there is constant flow of information and reminders about voting, changes in election processes are unlikely to influence voter participation.154 The authors also noted complaints by some voters living in jurisdictions with vote-at-home who were unfamiliar with how it worked. Voters cannot engage in the voting process if they do not understand how it operates or are skeptical of its utility; this could offer, at least in part, an explanation for lower turnout.155 A comprehensive literature review carried out by the Government Accountability Office (GAO) in 2016 examined vote-at-home’s impact on voter participation and found that most research showed a positive correlation between voter participation and vote-at-home policies.156 Similar findings have been reported elsewhere. A 2018 report examining voting behavior in Utah during the 2016 elections found that voter participation increased by 5 to 7 percentage points in the 21 counties using vote-at-home rather than traditional polling places.157 During the April 2018 elections, Anchorage, Alaska, experienced the highest voter participation in the city’s history after rolling out a new vote-at-home system, which included some vote centers and ballot drop boxes.158 And in Washington, which carries out all elections by mail, researchers found that vote-at-home increases voter participation by between 2 and 4 percent.159
One area where researchers tend to agree is that vote-at-home increases voter participation in elections with historically low participation. In local special elections, for example, vote-at-home has been shown to increase participation by about 7.6 percent.160 In the 2014 midterm elections, voter participation in vote-at-home states was, on average, 23 percent higher than in other states.161 In 2018, a county clerk estimated that vote-at-home increased voter participation in Kansas by 20 percent in a local election for sales tax.162 Furthermore, whereas most states see significant discrepancies between presidential and midterm elections, in 2014, voter participation in Colorado and Oregon was equal to the national average for the 2016 election.163 In Colorado, after implementing vote-at-home, the voter turnout gap between the 2014 midterms and the 2016 general election decreased by approximately 1.5 percent, compared with the gap between the 2010 and 2012 elections.164 In Oregon, vote-at-home has been shown to reduce the participation gaps between general and special elections by 11 percent.165
In implementing vote-at-home, states should abide by the Colorado model, which incorporates vote centers, as research suggests that voters prefer dropping their completed ballots off in person at a designated location rather than sending them through the mail.166 And since mail delivery can occasionally be unreliable—particularly for highly transient communities—eligible voters must have an alternative means of casting ballots.167 For example, surveys indicate that Native American voters prefer to vote in person, as they often experience problems with mail-in voting, including ballots never arriving, difficulty describing their voting addresses, and difficulty understanding how to fill out the ballot.168 Vote centers themselves have proven beneficial to improving participation, particularly for infrequent voters, and they reduce election administration costs, allowing election officials to focus resources where they are needed most.169
Vote-at-home may be a particularly good option for states with permanent no-excuse absentee voting lists, where individuals sign up to automatically receive an absentee ballot each election and where a large percentage of voters cast absentee ballots by mail already—as is the case in Hawaii, Arizona, and Montana.170 This year, some counties in California will begin transitioning to vote-at-home with drop boxes and vote centers.171 All states should offer voters the chance to sign up for permanent absentee voting lists and to automatically receive their ballots by mail. Doing so would provide voters with more convenient options and would help to increase voter participation. Finally, vote-at-home may be useful for jurisdictions lacking election resources and sufficient numbers of poll workers or for jurisdictions in which voters are located long distances from polling places. Vote-at-home is estimated to save $2 to $5 in election costs per registered voter.
Provide sufficient resources in elections and ensure voting is accessible
Even with the passage of affirmative policies, implementation matters. It is particularly important to make sure that enough resources are available to administer elections effectively. Poll closures, lack of voting machines, and insufficiently trained poll workers can contribute to long lines during voting periods and prevent eligible Americans from voting.
For example, a 2014 study by the Brennan Center for Justice found that the 10 precincts with the longest lines in Florida had fewer poll workers than the statewide average.172 Polling place closures also cause problems for voters, as fewer polling places often result in longer lines and wait times during voting periods. For example, after Maricopa County, Arizona, reduced its number of polling places by 70 percent during the 2016 primary, voters were forced to wait in line for up to five hours.173 A study from the Joint Center for Political and Economic Studies reported that long lines were estimated to have deterred at least 730,000 Americans from voting in the 2012 elections.174 That year, more than 5 million Americans experienced polling place wait times of at least one hour.175 Furthermore, according to a nationwide study, in 2016, roughly 3 percent of people standing in line at voting locations left before they could vote as a result of long lines.176
Polling place closures disproportionately affect communities of color. In 2016, North Carolina had 158 fewer early polling places in 40 counties with large black communities.177 And in Daphne, Alabama, city council members eliminated 3 of the 5 polling places located in a heavily African American district, leaving the number of polling places in majority-white districts largely untouched.178 Polling places were also closed or consolidated in several jurisdictions in Georgia. Seven of the locations that experienced closures were heavily African American, with longtime voters reporting that they would not participate in the 2016 elections due to mobility challenges and difficulty traveling longer distances to new polling places.179
Lack of convenient polling places and registrar offices also has been a problem for Native American would-be voters. Thirty-two percent of unregistered Native Americans in South Dakota and 26 percent in Nevada cited long distances from voter registrar’s offices as one of the reasons that they decided not to register. Additionally, 29 percent and 27 percent of respondents in South Dakota and Nevada, respectively, reported difficulty traveling to designated polling places to vote.180
Voters should not be forced to wait in line for hours to exercise their civic duty and for their voice to be heard in our democracy. Nor should certain groups have less access and fewer opportunities to register to vote and cast ballots. Recognizing funding constraints on election administration, officials must provide enough polling places and poll workers to serve all communities equally. Leading researchers at the Massachusetts Institute of Technology (MIT) developed a resource allocation calculator to help election administrators across the country determine how many polling places, workers, or voting machines a jurisdiction needs based on a variety of factors, including the number of registered or eligible voters within a particular area.181 Additionally, in order to prevent problems in future elections, officials should conduct assessments of Election Day readiness after each election to evaluate issues such as wait times, difficulties during voter check-in, and bottlenecks in the voting process.
Another way to reduce long lines is to adopt voter registration modernization reforms such as automatic voter registration, which ensures that voter lists are kept up-to-date, as inaccuracies or errors in voter registration databases can cause significant delays at polling places. Automating the registration process with information the state already has on hand eliminates clerical errors and helps prevent unnecessary confusion during voting periods. Ensuring that jurisdictions have an adequate number of accessible polling locations and hours—as well as poll workers and voting equipment—to accommodate the communities they serve will help to ensure that the right to vote is fully realized.
This extends to voters who are disabled and who speak different languages. In 2016, Americans with disabilities accounted for nearly 16 percent of the total eligible voter population, or 35.4 million eligible voters.182 However, that year, voter participation for people with disabilities was more than 6 points lower than for people without disabilities.183 One estimate suggests that there could have been 2.2 million more voters if people with disabilities had voted at the same rate as people without disabilities who had the same demographic characteristics.184 Unfortunately, in many polling places, impediments exist that make voting difficult for people with disabilities. A 2017 study by the GAO found that, of the 178 polling places observed for accessibility in 2016 during early voting periods and on Election Day, 60 percent had at least one potential impediment, such as steep ramps, inadequate signage indicating accessible pathways, and insufficient parking.185 Jurisdictions must invest resources to ensure that eligible Americans with disabilities have equal opportunity and access to cast ballots in elections and that their privacy is maintained at the voting booth.
To ensure eligible Americans with limited English proficiency can participate in elections, Section 203 of the Voting Rights Act requires certain jurisdictions to publish election materials—including voter registration information, election notices, and ballots—in other languages additional to English.186 Federal law also requires covered jurisdictions to offer oral assistance in minority languages.187 Part of the act, under Section 208, allows limited English speakers to exercise their right to receive language assistance from a person of their choosing, with certain exceptions, such as that person’s employer.188 An estimated 22 million limited English-proficient Americans who are eligible to vote are subject to these protections.189 Unfortunately, some poll workers are not aware of these federal requirements, while some states place unnecessary restrictions on how many voters a language-proficient person can assist, which may prevent limited English speakers from receiving the assistance they need.190 Between 3 and 4 percent of Native Americans in Arizona, Nevada, South Dakota, and New Mexico—four states with large Native American communities—cited language as a problem that they encountered when voting.191
All eligible Americans must have equal opportunity to vote, including access to ballots and election materials that facilitate their ability to do so. With help from local advocacy groups, covered jurisdictions should work closely with federal entities in order to ensure that they abide by federal law in providing language assistance to those who need it. And even if they are not covered by Section 203 of the Voting Rights Act, any jurisdiction with a large population of limited English-proficient speakers should ensure that polling places are staffed with bilingual poll workers.
Restore rights for formerly incarcerated people
When discussing policies for increasing voter participation, it is necessary to acknowledge the more than 6 million American citizens barred from exercising their fundamental right to vote because of ex-offender disenfranchisement laws.192 According to the Brennan Center for Justice, 48 states and the District of Columbia have laws that prohibit those who are incarcerated from voting. Fifteen states and the district automatically restore voting rights to formerly incarcerated people upon release from prison, while another 23 states restore voting rights upon completion of probation and/or parole.193 And, although seven states prohibit only people convicted of certain felonies, often the most violent crimes, from ever voting again, three states—Florida, Kentucky, and Iowa—prohibit anyone convicted of any felony from ever voting, even after completion of probation and parole.194 Some jurisdictions fail to provide pretrial detainees with absentee ballots or transportation to voting locations on Election Day, thereby disenfranchising individuals who have not been convicted of a crime and are eligible to vote.195 Felon disenfranchisement laws disproportionately affect people of color; in 2010, 1 in 13 black Americans were unable to vote due to a felony conviction, compared with 1 in 56 nonblack Americans.196
An estimated 93 percent—or about 14 million—of formerly incarcerated people are eligible to vote based on current rights restoration laws.197 Despite this, participation is low. In 2008, when voter participation in the United States reached almost 62 percent, one study found that participation for eligible formerly incarcerated people in five states—Florida, Georgia, Michigan, Missouri, and North Carolina—averaged around 22.2 percent.198 Voting-eligible formerly incarcerated people also register at low rates. A 2009 study of 660 formerly incarcerated people who were released from parole in Erie County, New York, found that, while 36 percent of participants were registered to vote prior to their conviction, only about 13 percent had registered or reregistered to vote post-conviction.199
Beyond this, studies have found that a negative relationship exists between voter disenfranchisement and black participation, even among those not directly involved in the criminal justice system. For example, in communities with high percentages of disenfranchised black voters, eligible black voters are less likely to vote.200 This negative relationship exists even when there are pro-voter reforms such as early voting and same-day registration.
Low participation among formerly incarcerated people may be due, at least in part, to the lack of information provided to them about their voting rights while incarcerated and upon release.201 One survey found that 68 percent of ex-offender respondents failed to demonstrate an accurate understanding of how their conviction affected their right to vote.202 Another study found that only 10 percent of ex-offender respondents self-reported being educated about their voting rights by a judge, prison staff, or parole staff.203 However, public education can make a difference. According to a survey, of ex-offenders who held an accurate understanding of how their convictions affected their voting rights, a majority planned to vote in future elections.204
States have approached ex-offender re-enfranchisement in different ways, which have included issuing executive orders, pursuing reform legislatively, granting individual pardons, and offering ballot initiatives. For example, in April 2018, New York Gov. Cuomo issued an executive order restoring voting rights to an estimated 36,000 formerly incarcerated people on parole.205 And in May, Louisiana Gov. John Bel Edwards (D) signed a bill restoring rights to formally incarcerated formerly incarcerated people five years after their release, even if they remain on probation or parole.206 Wyoming and Alabama also went the legislative route. In 2017, Wyoming enacted a law to automatically restore voting rights to certain first-time ex-offenders convicted of nonviolent felonies upon completion of their sentence.207 Also that year, lawmakers in Alabama limited the kinds of criminal offenses for which someone can be disenfranchised, restoring voting rights to thousands of formerly incarcerated people.208 And after the Virginia Supreme Court struck down his order to restore voting rights to more than 200,000 ex-offenders in the state, former Virginia Gov. McAuliffe (D) relied on individual pardons to restore the rights of more than 173,000 formerly incarcerated people who completed their sentences.209 More than 25,000 of those whose rights were restored participated in the 2016 elections in Virginia.210 From this, it is clear that there are a number of options through which states can work to restore the fundamental right to vote to those who have served their time.
Based on Virginia’s experience, all else being equal, if all ineligible formerly incarcerated people had their rights restored, there could have been approximately 914,728 more voters during the 2016 elections; and this figure would increase to 1.3 million if projections were based on the 22.2 percent average turnout observed in formerly incarcerated people during the 2008 elections. Here, it is worth repeating that demographics and voting cultures differ across states and even by jurisdiction, particularly in terms of outreach to and engagement of formerly incarcerated people whose voting rights are restored. Moreover, it is important to consider the 22.2 percent average turnout rate in the context of the historic 2008 elections, during which voter participation surged nationwide.211 Although these projections are not exact, they do provide a snapshot of how many more Americans could participate in the electoral process if their rights were restored.
This year, Florida voters will have the opportunity to vote “yes” on a 2018 ballot measure that would restore voting rights to millions of disenfranchised formerly incarcerated people who have completed their sentences and earned back their fundamental right to vote.212 Earlier this year in New Jersey, legislation was introduced to allow citizens to vote while incarcerated. Meanwhile, a bill in Illinois that is awaiting the governor’s signature would ensure that pretrial detainees who are effectively denied the right to vote in some places are provided voter registration forms and other voting materials.213 Legislation was also introduced in Colorado to preregister formerly incarcerated people on parole to vote, so that their rights would be automatically restored upon completion of their sentence. The bipartisan bill was estimated to affect 10,000 parolees in the state.214
Americans who complete their sentences should have their right to vote and voter registration automatically restored upon release from prison, as is done in Rhode Island.215 States with automatic voter registration should designate state-run departments of correction as qualified AVR agencies. Of course, any re-enfranchisement policy must be combined with a robust education and outreach program carried out by the state and detention facilities. The program must provide formerly incarcerated people with information verbally, electronically, and through hard copy. They must be informed of how their conviction affects their voting rights. If voting rights are not automatically restored upon release, public officials should provide continuing guidance on how they may be restored upon release or completion of probation or parole. In particular, corrections, probation, and parole officers should provide voter registration services when a justice-involved individual becomes eligible to vote. A 2015 study found that formerly incarcerated people who received outreach messages from the Connecticut secretary of state’s office reminding them of their eligibility to register to vote and participate in elections were more likely to register and vote than those who did not receive messages.216
Jurisdictions must stop suppressing voters
This report focuses on pro-voter policies to expand the electorate and improve the voter experience. Part of this involves protecting the right of all eligible Americans to have their voices heard, which means dismantling voter suppression. It is an attack on the integrity of our democracy when the voices of eligible Americans are silenced as individuals are turned away at the polls or removed from state voter registration rolls because of restrictive laws and burdensome practices.
Each election cycle, countless eligible Americans are prevented from voting because of voter suppression measures, including strict voter ID laws, voter purges, and documentary proof of citizenship requirements for voter registration.217 These voter suppression measures, which have arisen across the country, are often justified by false claims of voter fraud but are actually aimed at making the voting process more difficult for certain groups, particularly for communities of color.218
Before they even get to the polls, eligible voters are being removed from voter registration lists, which can result in them being turned away on Election Day. A 2017 report by the bipartisan U.S. Election Assistance Commission found that there was a 12.8 percent increase—equal to 1.9 million people—in the number of voters purged from state voter rolls between 2014 and 2016, compared with between 2012 and 2014.219 People of color are more likely to be targeted by state voter purges than whites. For example, in the lead-up to the 2016 election, Ohio removed thousands of people—846,000, according to some estimates—from its state voter rolls for failing to vote in previous elections.220 Between 2012 and 2016, more than 10 percent of voter registrants were purged in “heavily African-American” neighborhoods near downtown Cincinnati, compared with only 4 percent of those living in the surrounding suburb of Indian Hill.221 On June 11, in a 5-4 decision, the U.S. Supreme Court validated Ohio’s voter purging process, giving Ohio and other states its stamp of approval to manipulate voter rolls and keep eligible Americans, especially people of color, from participating in elections.222 Kansas Secretary of State Kris Kobach’s infamous Interstate Crosscheck System, widely criticized for being discriminatory and unreliable, is another purging tool that uses minimal search criteria to identify potentially ineligible voters, resulting in eligible Americans being misidentified as potential illegal voters.223 African Americans living in states that rely on Crosscheck have a 1 in 9 chance of being flagged as potentially ineligible. And for Hispanics and Asian Americans, those chances increase to 1 in 6 and 1 in 7, respectively.224
Communities of color, young people, and low-income Americans are also disproportionately affected by discriminatory voter registration requirements such as documentary proof of citizenship laws. These laws require eligible Americans to provide proof of citizenship in the form of a passport, birth certificate, or naturalization papers before they are added to the voter rolls.225 From 2013 to 2016, Kobach’s documentary proof of citizenship prevented more than 35,000 Kansans from registering to vote.226 People under the age of 30 made up 44 percent of those whose voter registrations were slated for removal from the state voter rolls due to failure to provide documentary proof of citizenship.227 This is striking, as people in this age group make up only 15 percent of all registered voters in Kansas.228 Documentary proof of citizenship requirements also have a discriminatory effect on communities of color since nearly 9 percent of voting-age African Americans lack access to birth certificates or passports, compared with 5.5 percent of whites.229 Furthermore, Americans earning less than $25,000 per year are nearly twice as likely to lack citizenship documentation, such as passports and birth certificates, as those who earn more than $25,000.230
Even if eligible Americans are successfully added to and remain on state voter rolls, they face other obstacles to casting a ballot. In seven states, strict voter ID laws require eligible voters to present certain forms of government identification before voting.231 Eleven percent of all Americans lack the kind of government-issued photo identification required by these laws. People of color are even less likely to have IDs than whites.232 Texas’ voter ID law, which was struck down in 2017 for being intentionally discriminatory, required eligible voters to present a driver’s license, passport, military identification, or gun permit prior to voting; yet student IDs were not accepted—even from state schools.233 A 2018 analysis found that 608,470 registered voters lacked the necessary ID to vote in Texas.234 The GAO has found that voter ID laws can reduce participation in elections by between 2 and 3 percent.235 For example, voting-eligible Native Americans in North Dakota were more than 7 percent less likely than non-Native Americans to have a qualifying voter ID under the state’s voter ID law.236 In April 2018, after finding that North Dakota’s law had a disproportionate effect on the state’s Native American population, a federal judge ordered the state to accept tribal documents as valid forms of ID and do away with requirements for residential street addresses.237 Furthermore, some states do not allow transgender people to change the gender marker on their driver’s license unless they meet burdensome requirements, such as proof of transition-related surgery, a court order, or an amended birth certificate.238 When a transgender person is unable to change the gender marker on their ID, poll workers and election officials may decide that the ID does not match the voter and wrongfully deny them their right to vote.239 In September 2016, the Williams Institute estimated that, in eight states with strict photo ID laws, 30 percent of transgender people who were eligible to vote were likely to be disenfranchised or face substantial barriers to vote in the November 2016 election.240 Americans with disabilities are also disproportionately affected by voter ID laws.241
To have truly free, fair, accessible, and secure elections, discriminatory strict voter ID laws, documentary proof of citizenship requirements, and other unnecessary barriers to voter participation must be repealed. When carrying out voter list maintenance, states must strictly abide by the remaining provisions of the Voting Rights Act and the NVRA, which place limits on how states may remove people from state voter rolls.242 Additionally, states should cease using Interstate Crosscheck and should instead sign on as members to the Electronic Registration Information Center.243 ERIC’s data-matching criteria are much more comprehensive than the Interstate Crosscheck System; they consider names, addresses, birthdates, and other points of comparison using official data from voter registration rolls, motor vehicle records, postal addresses, and Social Security death records. ERIC keeps state voter rolls up-to-date without compromising the privacy and security of citizens’ right to vote.
Strengthen civics education in schools
Eligible citizens are much less likely to engage in elections or government if they do not understand them. A 2016 survey found that only 26 percent of Americans could name all three branches of government, a decline from past years.244 Lack of understanding—including that of institutional checks and balances and mechanisms for holding government accountable—contributes, at least in part, to rising distrust in government and elected bodies. Only 20 percent of Americans trust the government to do what is right always or most of the time, according to a 2017 survey by The Pew Charitable Trusts.245
Public distrust and alienation lead to a vicious cycle of bad government representation. According to a 2016 survey, 57 percent of Americans agreed that “politics and elections are controlled by people with money and by big corporations so it doesn’t matter if they vote.”246 A 2018 survey by Suffolk University found that 68 percent of unregistered and registered but disengaged voters agree with the statement, “I don’t pay much attention to politics because it is so corrupt.”247 If people do not trust democratic institutions or understand political processes, they will not show up to the polls—a place where they could contribute to removing bad actors from office and electing responsive representatives. A 2018 study by Harvard University found that only 36 percent of young respondents disagreed with the statement, “Political involvement rarely has any tangible results.”248
It is important for our education systems to inform young people on how to engage effectively and be responsible citizens in the political process. Unfortunately, today’s students are largely ill-prepared for an active civic life. A 2014 study found that only 23 percent of 8th graders received a “proficient” or “advanced” score in civics.249 In 2016, the national average Advanced Placement U.S. government exam score was lower than the average score of all but three of the other 45 AP exams offered by schools.250
Americans recognize the important role civics education plays in our society. A 2018 survey found that, of those tested, the single most popular initiative to bolster U.S. democracy was a proposal to “ensure that schools make civic education a bigger part of the curriculum.”251 Recent CAP research shows that most state-required civics education curricula do not result in higher voter participation on their own.252 However, research shows that people who actively engage in political discussion and debate and who follow current events are more likely to vote. These tendencies should be encouraged at a young age in order to facilitate generations of lifelong voters. While most states do require some type of U.S. government or civics education as a graduation requirement, few states require more than a semester of civics education, and few curricula focus on building skills and agency for civic engagement. Weak civics curricula likely contribute to young people’s voting apathy. Studies suggest that robust community-integrated civics education programs that require young people and their families to play an active role in learning about the electoral process, developing issue salience, and building skills in debate and opinion expression can increase voter participation among young people as well as other household members. According to CAP research, the 10 states with the highest youth volunteer rates have a civics course requirement for graduation.
In the jurisdictions where it is used, Kids Voting USA, a “nonpartisan, grassroots-driven voter education program,” has seen some success in increasing participation—particularly for low-income students and people of color.253 The program includes interactive lesson plans; mock elections; homework assignments where parents engage with children on political subject matter; and other activities designed to educate and get kids excited about the act of voting and politics. A study of Kids Voting’s impact in Kansas found that, in Kansas counties that incorporated the program into school curricula, voter participation was 2.1 percent higher for both 18-year-olds and their parents than it was in counties without the program—even after controlling for other factors.254 Other studies have similarly shown that Kids Voting increases voter participation indirectly through student-parent discussions, attention to political news, and other factors.255 Another organization, Generation Citizen, aims to provide young people with “the knowledge and skills necessary to participate in our democracy as active citizens” and trains more than 30,000 middle and high school students through “action-oriented” civics lessons.256 In addition to performing research and analysis on policies and issues, students meet with state and local lawmakers, create petitions, write op-eds, and deliver presentations to their classmates.257 Educators reported that, by the end of the 2016-2017 school year, 80 percent of participating students increased their civic knowledge and 62 percent increased their civic motivation.258
Children between the ages of 0 and 18 account for more than 78 million people in the United States, almost a quarter of the country’s population.259 Every year, more of these individuals will become eligible to vote and have their voice heard in the democratic process of self-government. It is important that young people receive a civics education in which they learn about the role of state and local governments; the three branches of federal government; and state voting and registration requirements, so that they have a basic understanding of the electoral process to support their engagement once they become eligible to vote.260 However, to be successful in increasing voter participation, civics education should be community- and family-oriented. Educators should engage students in lively discussion about current events and should debate contentious issues, encourage students to participate in grassroots mobilization efforts, assign homework that requires civic discussions at home, and hold mock elections.261 These comprehensive programs must be intentionally designed to reach diverse student bodies and marginalized communities. Currently, one study found that students in low-income schools are 30 percent less likely than students in schools of average socio-economic status to have debates or panel discussions in classroom settings, and they are half as likely to learn how laws are made.262
Invest in integrated voter engagement and outreach
Groups that incorporate integrated voter engagement combine issue advocacy and organizing with voter mobilization and have been effective in harnessing voter power and enthusiasm in order to effectuate positive change in representation and policies within the communities they serve. IVE groups build issue salience that incentivizes people to vote by connecting the act of voting to making an impact on issues that affect people’s lives. They prioritize training local leaders in the community to mobilize their neighbors and peers, as studies show that people are more likely to listen to those whom they know.263 In addition to other community grassroots organizations, IVE groups partner with churches, unions, and social service agencies to organize voter registration drives and all-day volunteer events to assist voters with any problems that might arise on Election Day. IVE groups and their partners succeeded in registering nearly 4.5 million eligible voters between the mid-2000s and 2011.264
IVE groups do not just register and engage eligible voters during election seasons; their work continues year-round, long before Election Day and well after election results are certified. IVE groups work within communities—including with young people, low-income Americans, communities of color, limited English-proficient speakers, and people focused on specific issue areas such as environmental or racial justice—building trust through face-to-face interactions and helping eligible people to navigate the voter registration and voting process.265 Rather than discarding voter registration lists after Election Day, these groups retain and continually update them for the purposes of ongoing outreach, communications, and relationship building.
Make the Road, an IVE group focused on immigrant rights in New York, has registered more than 30,000 voters since 2011 and spearheaded a number of successful campaigns, including passage of an anti-wage theft law to protect immigrant workers.266 Advocacy by another IVE group, the Illinois Coalition for Immigrant and Refugee Rights (ICIRR), led to passage of the “We Want to Learn English” initiative, which has helped thousands of immigrants and refugees receive vocational English training and obtain other resources administered through nonprofit organizations and state agencies.267 Since 2004, the ICIRR has been responsible for registering almost 200,000 eligible voters and for mobilizing more than 600,000 to vote.268 In another example, Emgage, an IVE group focused on building political power for American Muslim communities, conducts civic trainings and candidate forums for Muslim voters and holds voter registration drives and voter outreach at mosques.269 Through mobilization and advocacy, Emgage has helped to elect Muslim lawmakers and defeat racist anti-Sharia bills.270 From 2012 to 2016, Muslim American voter participation increased by an average of 17.2 percent in states where Emgage engaged.271 And in 2016, an IVE group based in Los Angeles, Strategic Concepts in Organizing and Policy Education (SCOPE), played an integral role in passing two ballot measures that addressed issues of homelessness and affordable housing in L.A. communities.272 SCOPE’s efforts were found to increase voter participation by 6.6 percent in some targeted communities.273
Some partisan and nonpartisan organizations engage in grassroot efforts in order to drive participation. Outreach efforts may include canvassing, sending direct mailings, or holding phone banks to contact potential voters, among other things.274 Studies show that voters contacted through canvassing and direct outreach efforts are more likely to participate in elections.275 One study found that, generally, one additional vote is produced for every 14 people contacted by canvassers, while some volunteer phone banks have been shown to produce one additional vote for every 20 people contacted.276 Other studies show that voter contact in majority-African American neighborhoods can increase participation between 7 and 14 percentage points.277 Direct voter outreach has proven especially effective for young people. During the 2012 election, young people who were contacted by a campaign were 1.4 times more likely to vote than those who were not contacted.278 And between 2013 and 2017, Virginia saw a 114 percent increase in early and absentee voting among Latinos, after partisan and nonpartisan organizations devoted significant resources toward in-language advertisements, polling, and canvassing in Latino communities.279
All else being equal, had every registered and unregistered eligible but nonvoting American been contacted by canvassers, there could have been approximately 6.2 million more voters during the 2016 elections.
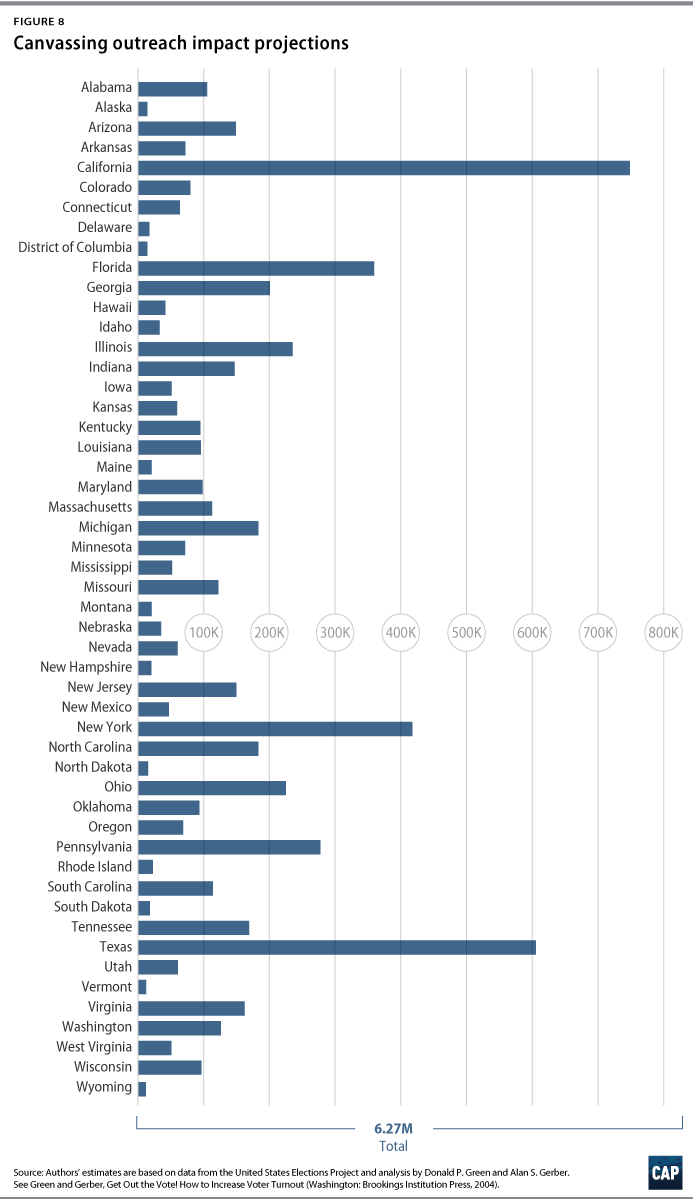
Conclusion
Our elected bodies are more representative and our laws are fairer when all eligible Americans are able to have their voices heard and to participate in elections. For voters who are disengaged and disenchanted with the political process, robust civics education programs and integrated voter engagement initiatives can drive participation by re-energizing voters and providing them with reasons and opportunities to cast ballots on the issues that matter most to them and their communities. Furthermore, states must have in place affirmative voter registration and voting policies in order to ensure that eligible voters who want to vote are able to and are not blocked by unnecessary and overly burdensome obstacles such as arbitrary voter registration deadlines and inflexible voting hours. By adopting the policies discussed in this report, America can find its 92 million missing voters and improve the voting experience for all eligible voters.
Methodology
The estimates for this report relied on a variety of sources. The authors used data from the United States Elections Project for calculations using the voting-eligible population (VEP) of each state, state-level turnout rates, and ballots counted in each state for the relevant years. In cases where the Elections Project did not have turnout data for a certain election, the authors relied on self-reported data from the voting and registration supplement to the Current Population Survey, which is conducted every two years by the U.S. Census Bureau. This supplement also provided turnout by demographic and registration rates for each state. The authors relied on the Sentencing Project for numbers of disenfranchised formerly incarcerated people in each state. Of course, demographics and voting cultures differ across states, and trends in voter registration rates and participation do not remain stagnant over time. However, while these estimates are not exact, they do provide an idea of how many potential voters could be engaged through the affirmative voting policies explored in previous sections of this report. The authors were unable to add up all of the individual increments to get a total effect if a state adopted all of the above policies and recommendations. This is due to concerns over double-counting, as some projected additional voters resulting from AVR may overlap with projected voters from policies such as preregistration and SDR.
Automatic voter registration: Projections of new voters registered through AVR were taken from the Center for American Progress report, “Close Elections, Missing Voices, and Automatic Voter Registration Projected Impact in 50 States.” Here, the authors estimated each state’s VEP using the 2015 1-Year American Communities Survey conducted by the U.S. Census Bureau. From there, they used the 2016 November supplement to the Current Population Survey in order to estimate registration rates in all 50 states. Next, they used data from the original analysis of AVR in Oregon and the resulting percentage of the unregistered population to pass through the Oregon Motor Voter (OMV) system in 2016, focusing on the subset of those unlikely to have registered themselves without AVR. The authors applied these values to the estimated number of unregistered voters in each state to find how many people per state would be registered through AVR and how many of these individuals could have been unlikely to register on their own. Oregon’s experience provides a road map to project how voter registration and participation could increase if each state adopted AVR. For example, roughly one-third of the 272,702 individuals registered to vote through AVR within the first year of its implementation in Oregon voted in the 2016 election. Similarly, of those registered, some 42.5 percent, or 116,000, were unlikely to have registered without AVR, and approximately one-third of the 40,000 previously disengaged people turned out to vote. CAP research finds that, if every state implemented AVR, more than 22 million registered voters could be added to state voter rolls in just the first year. All else being equal, if every state adopted the Oregon model of AVR, within just the first year of implementation, one could expect more than 7.9 million new voters nationwide—including 3.2 million previously disengaged voters. This analysis assumed that every state used Oregon’s model of an AVR system, had similar demographics to Oregon, and was made of people with similar voting behaviors as Oregonians.
Same-day voter registration: In order to estimate the number of additional people that would have voted in 2016 had every state implemented same-day voter registration, the authors used findings that states offering SDR see an average 5 percent increase in turnout. 2016 turnout was calculated by dividing the number of ballots cast by the state’s VEP. 2016 turnout was then multiplied by 1.05, thereby increasing it by 5 percent in order to find the projected turnout had the state implemented SDR. Multiplying this projected turnout by each state’s VEP provided the authors with the projected total ballots cast if states had implemented SDR. From there, the number of ballots cast in 2016 was subtracted from the higher projected ballots in the case of SDR to arrive at the number of additional voters in the 2016 election if every state had same-day registration in 2016.
Preregistration of 16- and 17-year-olds: The authors were unable to project the potential additional voters in 2016 had every state offered preregistration for 16- and 17-year-olds. The case studies of preregistration programs in Florida—which found that preregistered youths are 4.7 percent more likely to vote than those who registered at the age of 18 or older—did not provide several key data points with which the authors could extrapolate the effects of the policy on states without preregistration in place. For example, the data points did not include the percent of registrants in 2008 or 2016 who were preregistered to vote versus those who used traditional registration.
Online voter registration: The authors used Georgia’s success with online voter registration to project the potential 536,975 additional voters in 2016 had every state provided online registration. In Georgia, between 2014 and 2016, 25.5 percent of registration transactions were completed online. Approximately 71 percent of these registrants turned out to vote. To extrapolate this model to other states that did not have online registration available in 2016, number of registrants in 2014 was subtracted from the number of registrants in 2016 in order to get the number of new registrants between 2014 and 2016 for each state. Next, the authors took 25.5 percent of these new registrants to find how many new registrations in each state would be carried out online. Then, the number of online registrants in each state was multiplied by the 71 percent turnout rate for Georgia’s online registrants. This produced the number of additional people who would have voted in 2016 had states had online voter registration in 2014.
These numbers are conservative since people who simply updated their registration online were not taken into account in this projection. For simplicity’s sake, the authors only used the number of new registrations in each state. This analysis assumes that, between 2014 and 2016, every state would see the same rates of online registration and online registrant voter turnout as Georgia. It also assumes that those newly registering to vote will use the online registration tools as often as those simply updating their registration. The authors understand that this may not be the case, as it could be possible that online registration is used more often for quick registration updates rather than new registrations.
Early voting: In order to estimate the additional 789,527 people that would have voted in 2016 if every state had in-person early voting in place, the authors relied on the finding that early voting increases voter participation by 2 to 4 percent. 2016 turnout was calculated by dividing the number of ballots cast by the state’s VEP. 2016 turnout was then multiplied by 1.02, thereby increasing it by 2 percent in order to find the projected higher turnout had the state implemented early voting. Multiplying this projected turnout by each state’s VEP resulted in the projected total ballots cast if all states had early voting. From there, the number of ballots cast in 2016 was subtracted from the higher projected ballots in the case of early voting to arrive at the number of additional voters in the 2016 election if every state had early voting in 2016.
No-excuse absentee voting: The authors were not able to project the number of potential additional voters if every state had no-excuse absentee voting. Jan E. Leighley and Jonathan Nagler’s 2009 study found that states with the policy see increases of about 3 percent in voter participation over 28 years, but the methodology of their findings and their multivariate regressions were too complex to generalize and extrapolate to states that currently do not have the policy in place.
Vote-by-mail: The authors were not able to project how many additional voters would have turned out to vote in 2016 had every state conducted elections using a vote-at-home model. The success of these programs depends largely on geographic and voting habit determinants that vary widely across states and jurisdictions. As such, it is nearly impossible to quantify the success that such programs would have across different states.
Ex-offender re-enfranchisement: The authors’ analysis projects that between 914,728 and 1,355,605 formerly incarcerated people would have voted in 2016 had every state restored individuals with the right to vote after being incarcerated. To arrive at the floor projection, the authors used Virginia’s recent experience with ex-offender re-enfranchisement. In Virginia, 25,941 of the 173,166 formerly incarcerated people who had their voting rights restored by McAuliffe voted in 2016, amounting to a 14.98 percent turnout rate for the group.280 From there, the number of each state’s ineligible formerly incarcerated people—found at the Sentencing Project—was multiplied by 14.98 percent to arrive at 914,728 potential additional votes from formerly incarcerated people in 2016.281
To arrive at the higher projection, the authors used political scientist Traci Burch’s estimate that, on average, 22.2 percent of voting-eligible formerly incarcerated people in five states turned out to vote in 2008. All else being equal, and assuming that this 22.2 percent turnout rate held true in 2016, from there, the number of each state’s ineligible formerly incarcerated people was multiplied by 22.2 percent to arrive at 1,355,605 potential additional votes from formerly incarcerated people in 2016.
Civics education: The authors were not able to project how many additional voters would have turned out in 2016 had they participated in civic engagement programs. Civics education programs vary widely in curriculum, duration, and their effect on young people’s willingness to participate in elections. As such, it is nearly impossible to quantify the content of the programs and to attribute young people’s differential turnout rates to their involvement in a civics education program.
Integrated voter engagement and outreach: In their 2004 study, political scientists Donald P. Green and Alan S. Gerber found that one additional vote is produced for every 14 people contacted by canvassers. Using this statistic, the authors found that 6,266,618 additional people would have voted in 2016 had all voting-eligible individuals who did not vote that year been contacted by canvassers. To derive this projection, the authors found the number of voting-eligible individuals who did not vote in 2016, for each state, by subtracting the number of ballots cast in 2016 from the state’s VEP. The result was divided by 14 in order to find the 1 in 14 additional eligible voters who would have voted in 2016 had they been contacted by canvassers.
Despite the finding that, in majority-African American neighborhoods, participation increases by at least 7 percent when individuals are contacted by canvassers, the authors were unable to further project how many African Americans could have been activated and turn out to vote. This is largely due to the inability to assume that an African American neighborhood only includes African Americans.
About the authors
Danielle Root is the voting rights manager for Democracy and Government at the Center for American Progress.
Liz Kennedy is the senior director of Democracy and Government Reform at the Center.
Acknowledgements
The authors would like to thank the following people for their contributions to this report: Tova Wang, Ruy Teixeira, Amber McReynolds, Elena Nunez, Jenny Flanagan, and Phil Keisling.