This report contains corrections.
Introduction and summary
The recent elections of Donald Trump and Barack Obama were influenced in no small measure by shifts in the nation’s underlying demographic structure—the rise of communities of color, the increase in the number of older Americans, the sharpening of education divisions—and the distinctive voting behavior of these demographic groups. This 2018 report of the States of Change project, the fourth in an annual series,1 examines an array of future presidential election outcome scenarios—from 2020 through 2036—that could arise as the demography of the nation and its 50 states changes over the next 18 years.
These scenarios, developed by the authors, include outcomes that favor both Republican and Democratic candidates. They are not intended as predictions but are simulations based on assumptions about different demographic groups’ future voting patterns. Each of the alternative scenarios assumes the same projections for the nation’s underlying demographic structure of eligible voters (EVs) with respect to race, age, and education attainment. As such, the scenarios provide for a more in-depth understanding than national or state polling trends can supply about how emerging voting patterns may interact with changes in the demography of the nation’s electorate to affect future popular vote and Electoral College outcomes.
Many analysts suggest that if current voting patterns remain the same as in recent elections, the projected rise of communities of color—Hispanics, blacks, Asians, and others—will favor Democrats as the Republican-leaning white share of the electorate shrinks. However, the aging of the population and the continued substantial political clout of whites without college educations played a key role in electing Republican Donald Trump. Because the demography of these latter groups differs across states in ways that tend to benefit Republicans, this report finds that quite a few future scenarios could mimic the result of the 2016 election—a Democratic win in the popular vote with a Republican win in the Electoral College.
The 2020 through 2036 presidential election scenarios presented here are of four types:
- Assuming 2012 and 2016 voting patterns in future elections: Not surprisingly, a scenario that attributes the voting patterns of all groups from Obama’s 2012 win to future more racially diverse populations, yields solid Democratic popular vote and Electoral College wins from 2020 through 2036.
More surprisingly, changing demography has a clear impact on future outcomes when Trump’s 2016 voting patterns are attributed to the 2020 population. Here the modest shift toward more racially diverse voting populations in several states is enough to provide Democratic wins in both the popular vote and Electoral College—not only in 2020 but in subsequent elections.
However, the 2016 election result was unusual because of a high level of third-party voters. When those extra third-party voters are allocated back to one of the two major parties, based on underlying partisan preferences, projections to 2020 show a dead heat in the Electoral College.
- Voting assumptions about communities of color: Several scenarios assume that future voting patterns of racial groups will differ markedly from those observed in 2016. Taking note that whites tend to have the highest voting turnout rates of all racial groups, a scenario that assumes that all racial groups turn out at the same rate improves the voting clout of racial minorities, especially Hispanics and Asians. When this assumption is made—while leaving other aspects of 2016 voting constant—Democrats win both the popular and Electoral College votes in 2020 as well as subsequent elections. Additional scenarios for blacks assume their 2012 turnout rates, their 2012 Democratic voting preferences, and both together—which factored into Obama’s election victory—continue in the future. In all three of those black voter scenarios, Democrats win both the popular vote and Electoral College in future elections.
However, there is one scenario here that yields Republican Electoral College—though not popular vote—wins: a pro-GOP margin swing of 15 points among Hispanics, Asians, and other nonblack racial minorities. But if these groups shift their margins by the same amount toward Democrats, the latter party wins by large margins in 2020 and future elections.
- White college graduate versus white noncollege-educated voting preferences: The 2016 election showed a sharp divide in Republican voting between white college graduates and whites without college educations. Among the simulations examined, the greatest opportunity for Republicans to extend their 2016 victory model assumes an expansion of the already-substantial voting margin that the GOP has gained among white noncollege-educated voters. When this margin is expanded by 10 points, Republicans win both the 2020 Electoral College and popular vote. They continue to win the Electoral College—though not the popular vote—through 2036, despite broadening diversity and other predicted changes across the country.
Several other scenarios are explored by shifting future voting patterns of white college graduates and whites without college educations in different ways. While strong Democratic wins occur when either group shows improved Democratic support, it is clear that the most persistent gains for Republicans come from those scenarios where they improve their appeal to noncollege-educated whites.
- Voter group trade-offs: Several scenarios assume that voting swings toward one party on the part of one demographic group could precipitate a backlash voting swing toward the other party among another group. One scenario postulates that an increased Republican margin of 15 points among Hispanics, Asians, and other nonblack minority groups, perhaps due to increased outreach efforts, might trigger a swing toward greater Democratic support—back to relatively good 2012 levels—among noncollege-educated whites. In such a trade-off, Republicans would be disadvantaged and lose both the 2020 popular and Electoral College vote. In another simulation, a Republican swing of 10 points among noncollege-educated whites is countered by Democratic swings of 10 and 15 points, respectively, among white college graduates and among Hispanics, Asians, and other minorities. This simulation also yields 2020 Democratic popular vote and Electoral College victories and bigger ones thereafter. But in a scenario where increased Republican success among white noncollege-educated voters is traded for increased Democratic success among white college graduates, the GOP does gain an Electoral College victory in 2020, even while losing the popular vote.
In many of the simulations that favor Democrats in the Electoral College, especially those beyond 2020, swing states that favored Republicans in the 2016 election turn Democratic. These include Florida, North Carolina, Georgia, and Arizona, in the Sun Belt, as well as Pennsylvania, Michigan, Wisconsin, Iowa, and Ohio in the North. But in scenarios where Republicans are Electoral College victors, they retain most of their 2016 swing states and often add new ones, including Nevada, Minnesota, New Hampshire, and Maine.
The scenarios in this report suggest that there are paths for both parties to win the Electoral College in 2020 and beyond. For Republicans, future success is tied to mobilizing their strength among whites without college educations—a still-substantial but shrinking portion of the electorate—while attaining gains among at least some growing demographic groups. A narrow Republican reliance on noncollege-educated whites would lead, at best, to continued popular vote losses and ever smaller Electoral College wins, which would eventually peter out.
While Democrats appear to have the advantage in future popular vote contests, their success in the Electoral College will likely require some combination of intensifying their support among voters of color and improving their margins among white, particularly white noncollege-educated, voters. This delicate balancing act will provide a challenge for the party that cannot be met by simply waiting for demographic change to reshape the electorate.
Demographics and the U.S. electorate
Demographics are not destiny, but steady and predictable changes to the electorate play an important role in defining the landscape of American elections. The authors have every reason to suspect that the composition of the American electorate will change dramatically over the next five presidential elections. These shifts—which vary considerably state by state—will force parties and candidates to recalibrate their strategies for success goinfg forward.
This report explores how these demographic changes could shape the next five presidential elections using national and state projections produced by the States of Change project. In a 2015 report,2 this project presented long-term projections to 2060 of race and age profiles for the populations and eligible electorates of all 50 states. The authors have since supplemented these data with education projections, further segmenting the population into those with four-year degree and those without. This report focuses on what those projections imply for the presidential elections between 2020 and 2036 under different assumptions about future turnout and voter preference patterns.
The States of Change: Demographics and Democracy project is a collaboration supported by The William and Flora Hewlett Foundation and the Democracy Fund that brings together the Center for American Progress, the Bipartisan Policy Center, demographer William H. Frey of the Brookings Institution, and the Public Religion Research Institute. The views expressed in this and other States of Change reports are those of the authors and not the institutions sponsoring the project.
The project’s goals are:
- To document and analyze the challenges to democracy posed by the rapid demographic evolution from the 1970s to 2060
- To project the race-ethnic composition of every state to 2060, which has not been done in more than 20 years
- To promote a wide-ranging and bipartisan discussion of America’s demographic future and what it portends for the nation’s political parties and public policy
How is the electorate changing?
The national story
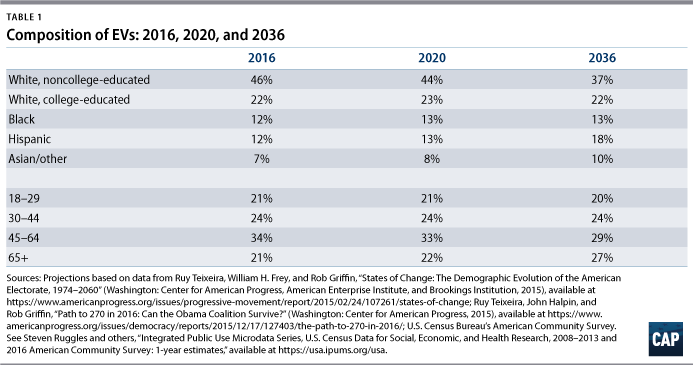
First and foremost, the eligible voter (EV) population is becoming more racially diverse. Younger, incoming generations of Americans are more racially diverse than prior generations. As they come of voting age, they will slowly but surely alter the makeup of the electorate. Whites made up 69 percent of EVs in 2016—a figure expected to drop to 67 percent by 2020 and 59 percent by 2036. During this time period, the Hispanic population is expected to grow by 6 points—going from 12 percent in 2016 to 18 percent in 2036—while Asians and other racial groups grow by 3 points, or 7 percent to 10 percent. The share of EVs who are black will be mostly stable—rising less than 1 percent between 2016 and 2032.
Second, the population is aging. Those 65 years old and older will make up a larger share of EVs—going from 21 percent in 2016 to 22 percent in 2020 and to 27 percent in 2036—while those ages 18 through 64 will shrink. While seniors will continue to be less racially diverse than younger age groups over this period, white senior EVs as a share of all EVs will rise by only a single percentage point from 2020 to 2036. The overwhelming majority of growth in the 65 and older age category is going to come from people of color.
Finally, the electorate is becoming more educated. This change is particularly important among whites, where the political and behavioral differences between those with and without college degrees tend to be largest. While whites without a college degree made up 46 percent of EVs in 2016, this group is expected to drop to 44 percent by 2020 and 37 percent by 2036.
The state-by-state story
Like most trends, the changes occurring nationally are not evenly distributed. Some places are changing quickly and others much more slowly. This will naturally shape how quickly states respond politically to overall demographic trends.
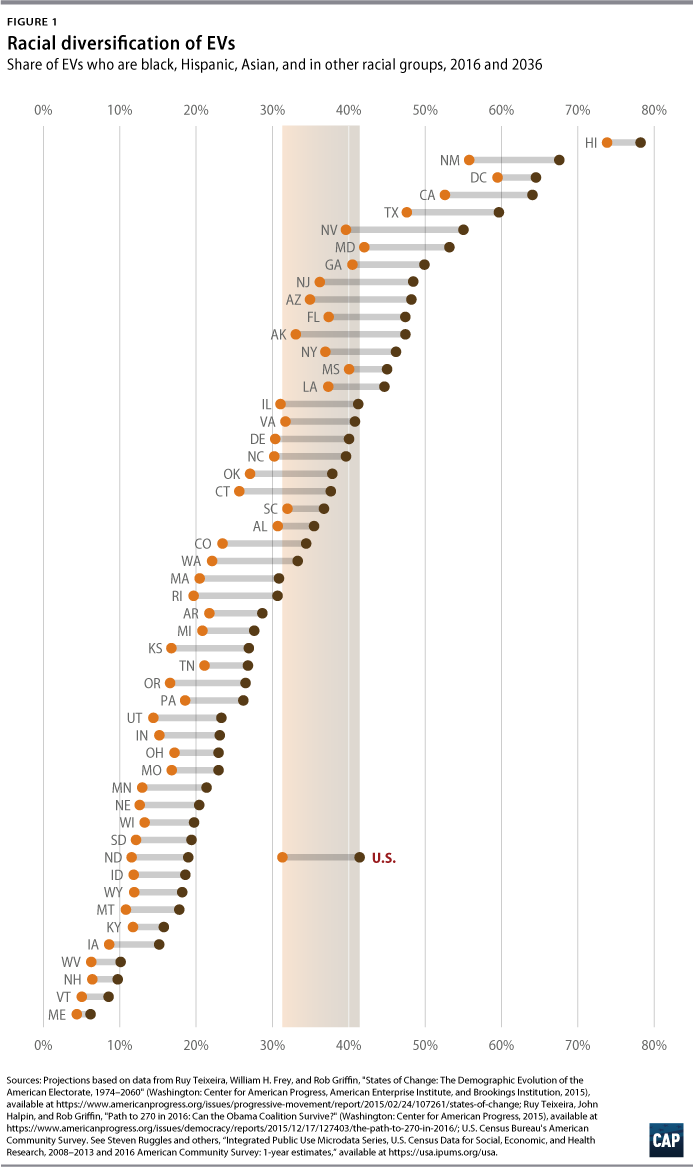
Sharp increases in diversity can be highlighted by looking at those states where racial minorities should comprise more than 40 percent of the eligible electorate. In 2020, there should be six states over this threshold: four states—Hawaii, New Mexico, California, and Texas for the first time, as well as the District of Columbia—where minorities are more than half of EVs, plus Maryland and Georgia, where minorities will make up between 40 percent and 50 percent of EVs. By 2036, eight additional states should cross the 40 percent threshold: Arizona, Alaska, New Jersey, Nevada, Florida, Mississippi, New York, and Louisiana. Also four additional states should have majority-minority eligible electorates: Texas in 2019, Nevada in 2030, Maryland in 2031, and Georgia in 2036.
At the other end of the continuum, the number of states where whites exceed 80 percent of EVs should be reduced from 23 states in 2020 to just 11 states in 2036. In 2036, the 11 still-heavily white states should include the three upper New England states of Maine, Vermont, and New Hampshire; the Southern states of West Virginia and Kentucky; the Midwestern states of North Dakota, Iowa, and Wisconsin; and the Western states of Montana, Idaho, and Wyoming. Notably, by 2036, the traditionally heavily white state of Utah should no longer be part of this group, as racial minorities will comprise 25 percent of its EV population due to the projected dispersion of Hispanics and other racial groups throughout the state.
Looking more closely at the demographic projections of selected Southern and Western swing states, it is clear that the Hispanic presence in particular should become quite a bit stronger in several of these states, including Nevada and Florida, where Hispanics are projected to become more than one-quarter of the eligible electorate in 2036. Due to additional substantial gains by Asians and other races, Nevada’s white share of EVs should plummet from 58 percent in 2020 to just 45 percent in 2036. North Carolina and Virginia should maintain their sizable black electorates and also show significantly increased shares of other voters of color. This is also the case for Georgia—a swing state in waiting—whose 2036 eligible electorate will be more than one-third black and 15 percent Hispanic, Asian, and other nonwhite groups. And two other potential swing states, Texas and Arizona, display sharp drops in their white EV profiles, with substantial gains among Hispanics and other nonwhite races.
Several Northern swing states show smaller gains in diversity. By 2036, Iowa’s EVs will still be 84 percent white; Wisconsin’s will be 80 percent white; and Ohio’s will be 77 percent white. The populations of all three states, as well as several of their Northern counterparts, will also be older than their counterparts in the South and West. This could help the GOP consolidate their gains in these states, especially if white seniors maintain their voting preferences despite generational turnover in this group.
Potential influence of demographic changes on future elections
To assess how demographic change might affect future elections, the authors performed a number of different simulations, each of which assumes that the nation’s underlying EV population will change according to race, age, and education projections in every state. The simulations differ only in what voter turnout and Democratic and Republican preferences are assumed for race, age, and education groups in the various states. However, before diving in, it is worth considering the value of such an exercise and what can reasonably be learned from it.
First and foremost, these are simulations—not predictions. When talking about results under a given set of assumptions, the authors are not expressing the belief that this is what will happen in a given presidential election. At heart, these are thought experiments—revealing tomorrow’s contours under a certain set of assumptions.
Additionally, those assumptions will almost certainly be wrong in ways both big and small. While the expectations the authors have about the underlying race, age, and education makeup of the electorate are probably the soundest of their assumptions, those pertaining to voter behavior are more likely to stray from reality. This is not a problem unique to this endeavor—the future itself is inherently uncertain—but it is one worth keeping in mind. As such, the results presented here are best thought of as baselines rather than ironclad truths.
Overview
This report investigates four types of scenarios to see how the electoral future might look under a variety of assumptions. These are:
- If future turnout and party preferences by group match those of the most recent presidential elections
- If turnout or support levels shift significantly among communities of color: blacks, Hispanics, Asians, and those of other races
- If support levels shift significantly among whites with and/or without a college education
- If there are trade-offs between different voting blocs with gains among one group resulting in losses in another
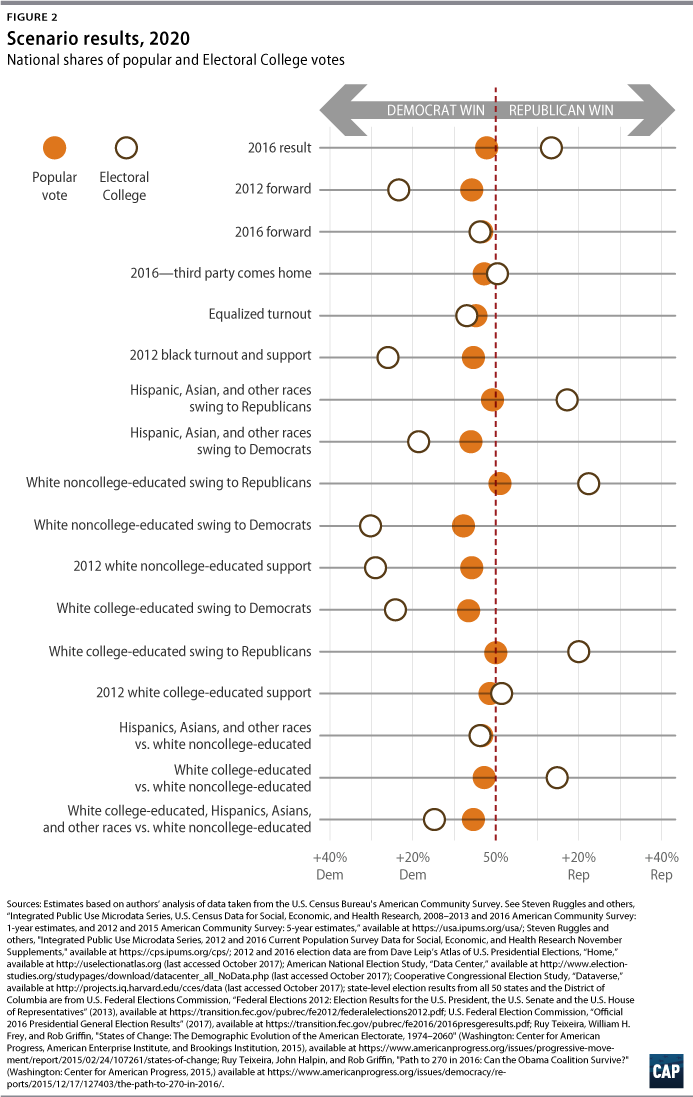
The results of each simulation are discussed in detail below, but the top-line results for 2020 are displayed in Figure 2. These 2020 results may be summarized as follows:
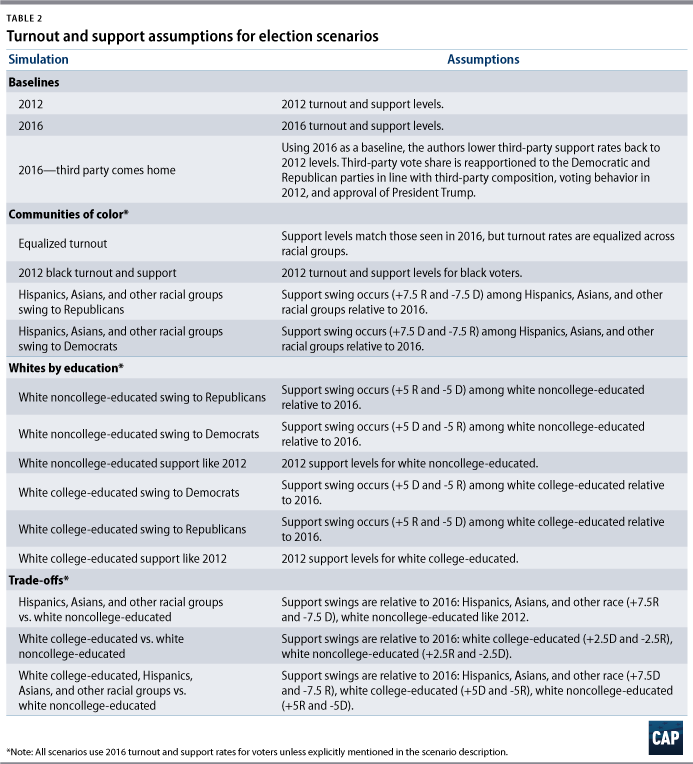
Baselines
- 2012 baseline: Democrats would win the popular vote by 6 points, and the electoral vote would go to the Democrats 332-206—same as the actual 2012 election.
- 2016 baseline: Democrats would win the popular vote by 3 points, and they would take back Michigan, Pennsylvania, and Wisconsin to carry the Electoral College 279-259.
- 2016 baseline, coming home: Democrats would take the popular vote by a little under 3 points, but there would be a 269-269 tie in the Electoral College.
Communities of color
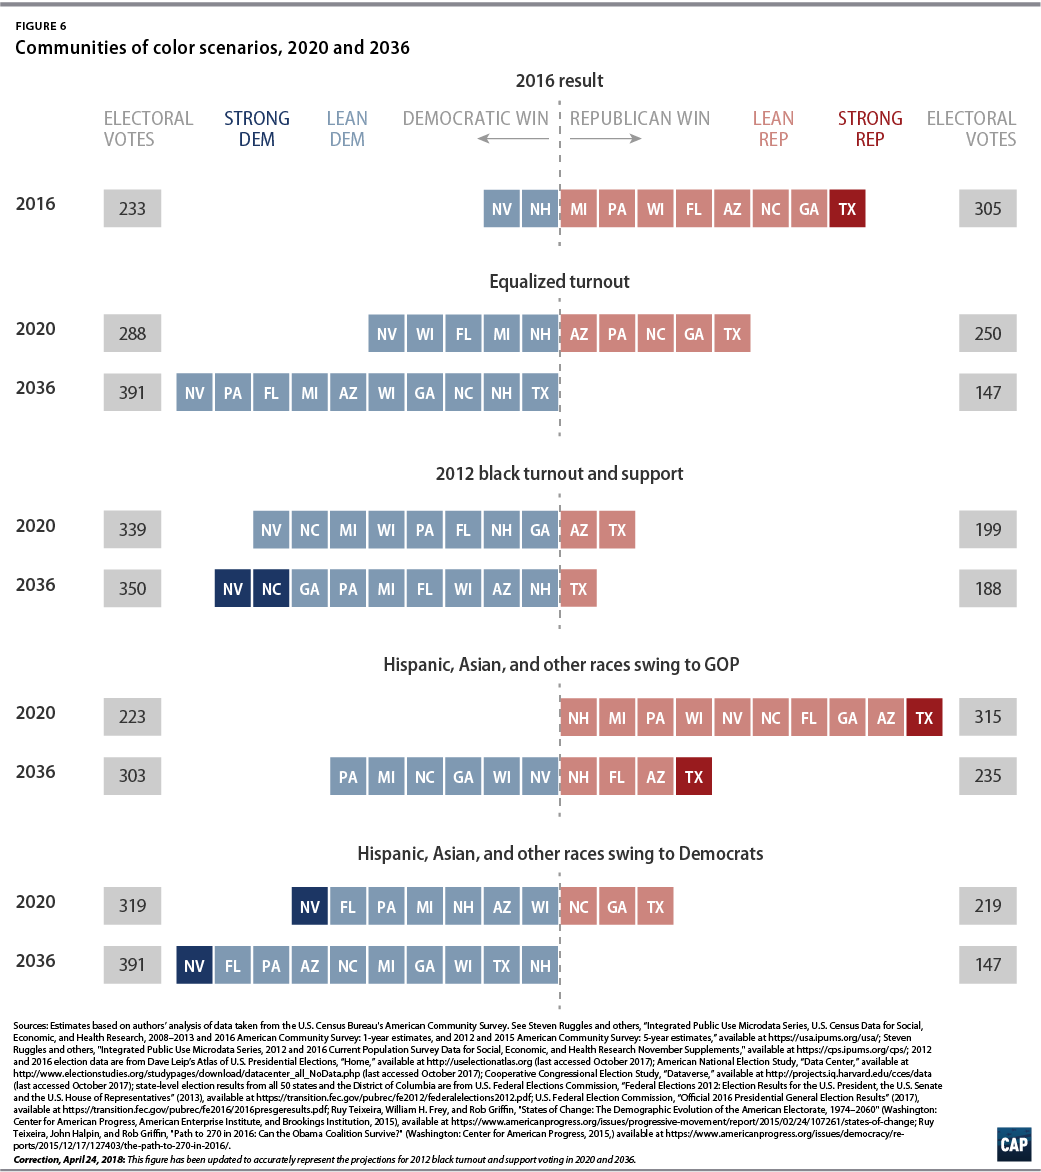
- Equal turnout by race: Democrats would carry the popular vote by 4.5 points and the Electoral College by 288-250.
- Black turnout or support like 2012: If black turnout or support or both are like that of the 2012 election, Democrats would win the popular vote by 4 to 5 points and the Electoral College with 294 to 338 electoral votes.
- Hispanics, Asians, and other races swing to GOP: Democrats would narrowly win the popular vote by .8 points, but the GOP would win the Electoral College easily by 315-223.
- Hispanic, Asians, and other races swing to Democrats: Democrats would carry the popular vote by 6 points and the Electoral College by 319-219, including flipping Arizona.
Whites by education
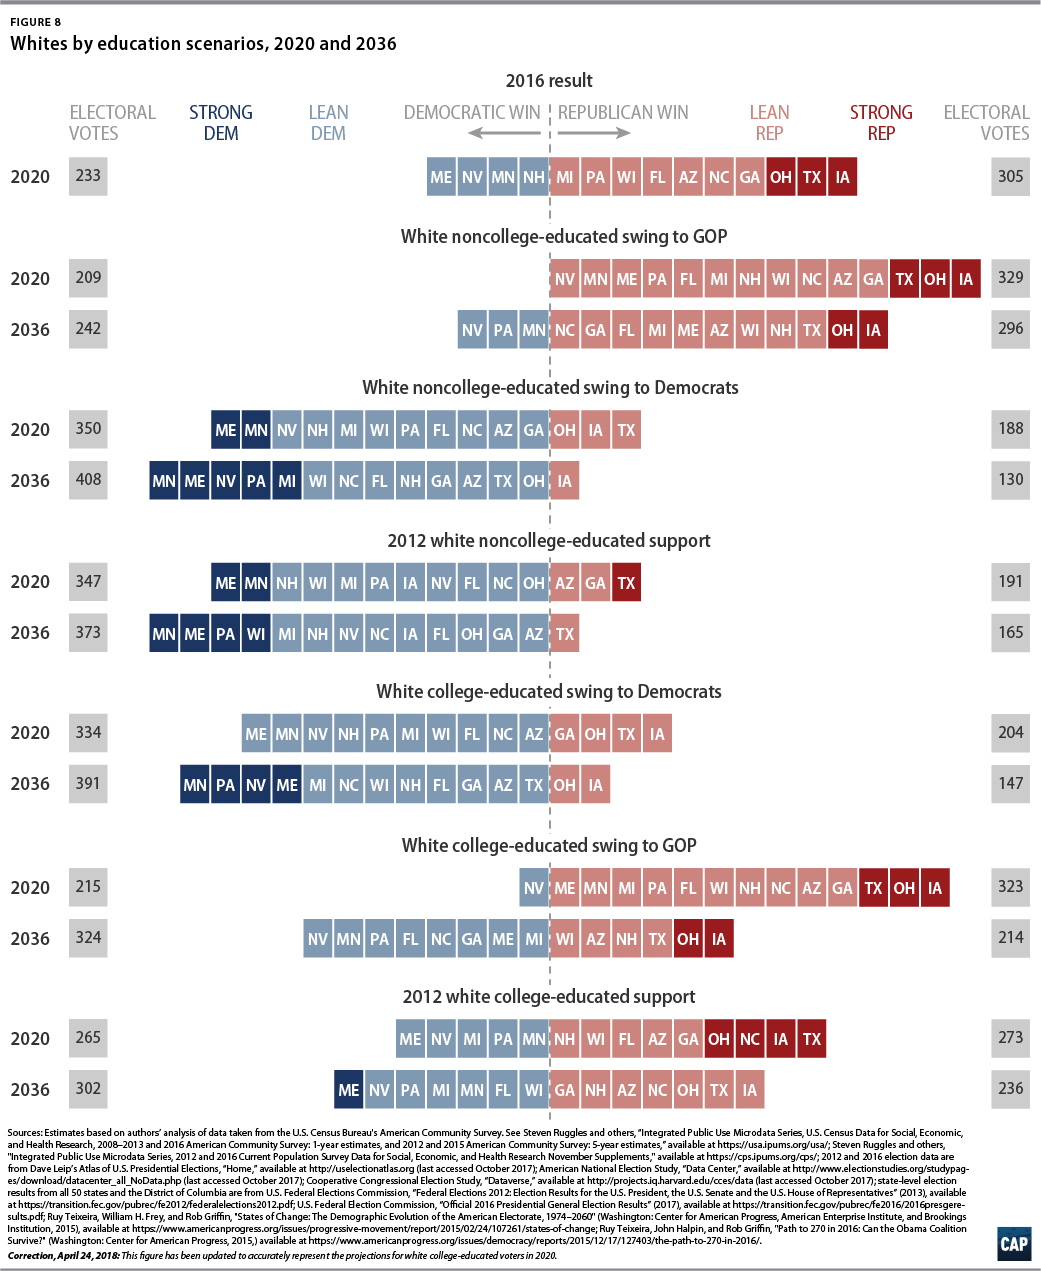
- White noncollege-educated voters swing to GOP: Republicans would carry the popular vote by 1 point and win the Electoral College easily by 329-209, flipping states such as Nevada and Minnesota.
- White noncollege-educated voters swing to Democrats: Democrats would win the popular vote by more than 7 points and dominate the Electoral College by 350-188, including flipping Arizona and Georgia.
- White noncollege-educated voter support like 2012: Democrats would carry the popular vote by almost 6 points and win the Electoral College 347-191, including taking back Ohio and Iowa.
- White college-educated voters swing to Democrats: Democrats would win the popular vote by more than 6 points and win the Electoral College by 334-204, including a flip of Arizona.
- White college-educated voters swing to GOP: Democrats would still carry the popular vote very narrowly by .2 points, but Republicans would win the Electoral College by 323-215, flipping states such as Maine and Minnesota.
- White college-educated voter support like 2012: Democrats would win the popular vote by only a little more than 1 point and the GOP would narrowly carry the Electoral College 273-265.
Voter group trade-offs
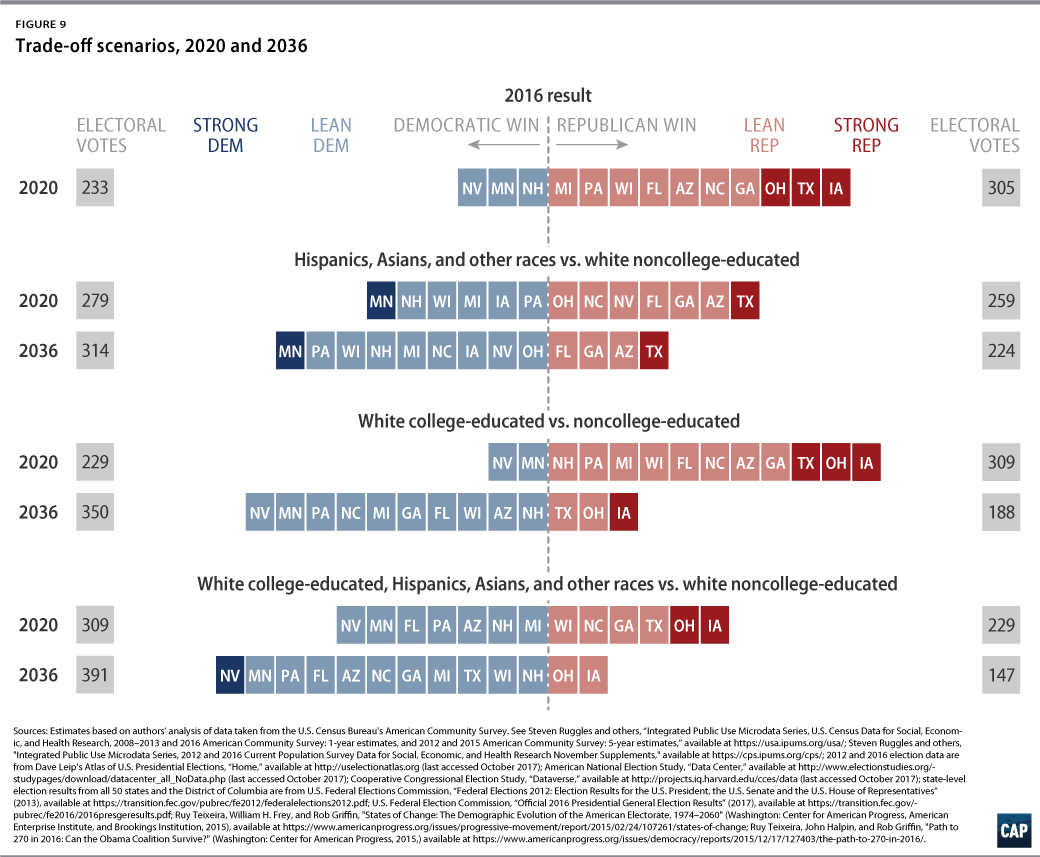
- Hispanics, Asians, and other races for white noncollege-educated voters trade-off: In a scenario where Republicans trade more new voter of color support for less white noncollege-educated voter support, the Democrats would carry the popular vote by more than 3 points, and the GOP would lose the electoral college 279-259, as Rust Belt states flip back to the Democrats.
- White college graduates for white noncollege-educated voters trade-off: In a scenario where Republicans trade more white noncollege-educated voter support for less white college support, the GOP loses the popular vote by a little under 3 points but carries the Electoral College 309-229.
- Hispanics, Asians, and other races and white college graduates for white noncollege-educated voters trade-off: In a scenario where Republicans trade more white noncollege-educated voter support for less support among Hispanics, Asians, and other races as well as white college graduates, Democrats would win the popular vote by 5 points and the Electoral College 309-229, including a flip of Arizona.
The wide range of scenarios considered here mostly have Democrats in 2020 maintaining and, in many cases, strengthening their popular vote victory from 2016. Indeed, in only two cases do the authors actually see a Republican popular vote victory in 2020: a 10-point pro-GOP margin swing white noncollege-educated voters and a 10-point pro-GOP margin swing among white college graduates—and, in the latter case, only if the third-party vote is reallocated.
Since Democrats registered popular vote advantages in almost all scenarios in 2020, it should be no surprise that they do so for later elections as well. In the projections that show a Democrat popular vote advantage in 2020, Democrats achieve even greater margins in each subsequent election as the projected demographic makeup of the eligible electorate continues to shift in a direction generally favorable to Democrats.
But, critically, it is electoral votes based on state outcomes, not the nationwide popular vote, that determine the winner in presidential elections. As this discussion details, many Democratic popular vote victories in these simulations do not translate into Democratic electoral vote victories.
In the 2020 election, these simulations include a scenario where Republicans gain a 15-point margin swing in their favor among Latinos, Asians, and those of other races, and a number of scenarios where the education gap among whites plays a key role. The following scenarios result in a GOP Electoral College victory but a popular vote loss: The GOP gets a 5-point margin swing from white noncollege-educated voters twinned with an equal swing toward the Democrats among white college-educated voters; a 10-point swing in Republicans’ favor among white college graduates; and a reversion to 2012 support margins among white college-educated voters. The exception to this pattern is the scenario in which Republicans gain a 10-point margin swing from white noncollege-educated voters, where the GOP carries both the Electoral College and the popular vote. Finally, simply leaving turnout and voter preferences as they were in 2016 while demographic change continues, yields a probable Republican Electoral College victory—though popular vote loss—if the third-party vote reverts to 2012 levels.
Thus, the GOP has many roads to the presidency in 2020 even though demographic shifts appear to make a Democratic popular vote victory easier than ever to obtain. Even more interesting, some of these fruitful scenarios continue to produce Republican electoral vote triumphs in 2024 and beyond, despite mounting popular vote losses. Their strongest future prospects are linked to a widening education gap among whites in their favor. Conversely, the brightest prospects for the Democrats are linked to an education gap among whites that widens in their favor, though they would also benefit greatly from stronger turnout and/or support among voters of color.
Detailed discussion of all scenarios is provided below.
Baselines
2012
The 2012 presidential election was a good year for Democrats. President Obama won the national popular vote by about 4 points and handily carried the Electoral College at 332-206. Notably, it marked a high point for black turnout, which surpassed that of whites for the first time in the modern political era.
Using this election as a baseline—that is, replicating the turnout and vote preference patterns of 2012 by demographic group but using the 2020 distributions of these demographic groups—the authors find that in 2020, a Democratic candidate would replicate the 332-206 Obama electoral vote victory of 2012. Here the exact same distribution of states is seen between Democrats and Republicans as in 2012, but with larger margins for the Democrats in the states they carry—reflecting the changing populations in these states. Nationally, Democrats would increase their popular vote margin3 by about 2 points compared with their margin in 2012—going from a 3.9-point to a 5.8-point win.
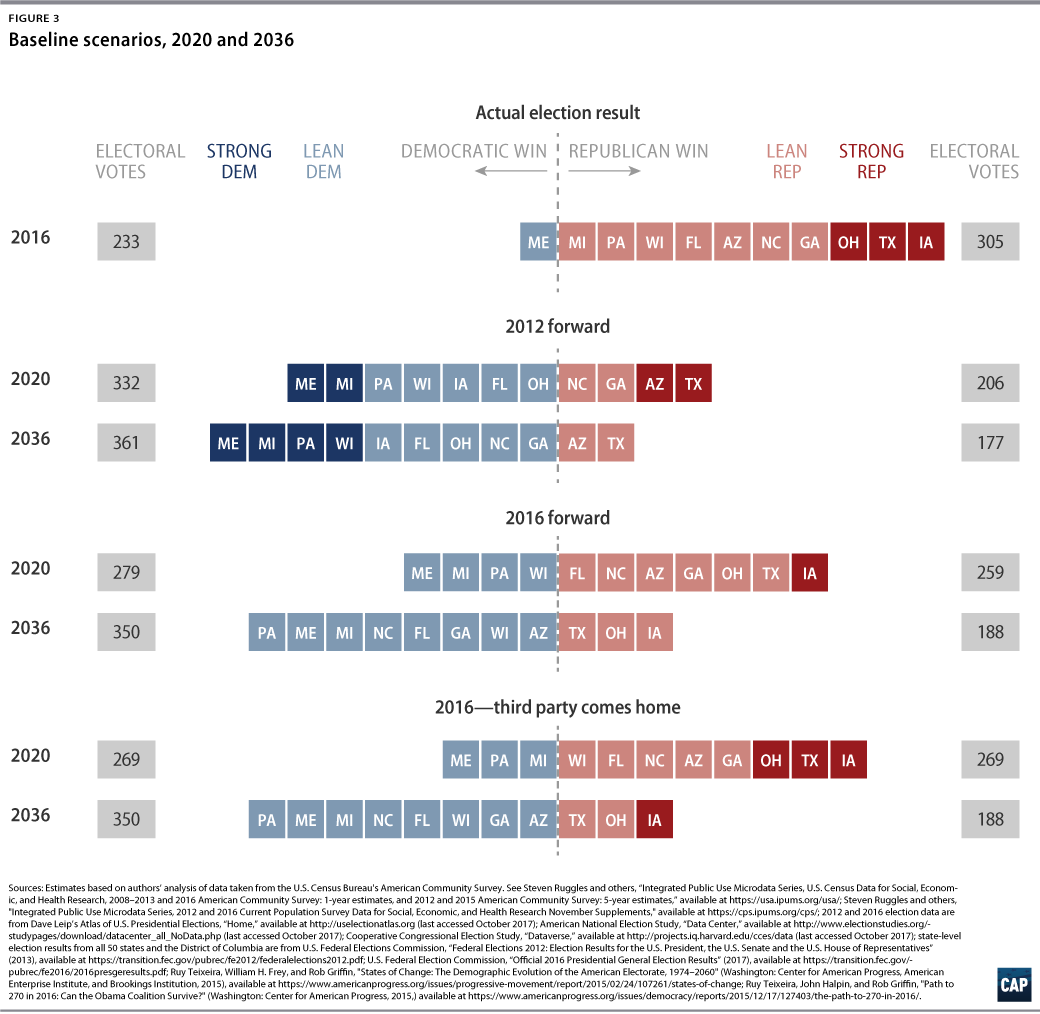
Looking further into the future, this simulation shows a 345-193 Electoral College win from Democrats in 2024 as North Carolina goes blue and a 361-177 win in 2032 and 2036 as Georgia flips. Although no other states flip into the Democratic column in this time frame, we see several Republican states’ margins shift into “swing” territory—a margin of less than 7.5 points: Arizona by 4 points, Mississippi by 5.1 points, Missouri by 5.8 points, Indiana by 7 points, and Texas by 7 points.
2016
The 2016 presidential election had a number of interesting features compared with 2012. First and foremost, there was a significant divergence between the popular vote and the Electoral College. While Hillary Clinton won the national popular vote by 2.1 points—about 2.8 million votes—Donald Trump won the Electoral College 304-227, or 306-232 without faithless electors. This was driven in large part by an increase in the white education divide. Although in recent history, whites without a college degree have voted Republican more than whites with a degree, those differences were notably larger in 2016. In addition, the turnout and support rates of blacks for Democrats in 2016 were lower and similar to those reported in 2004—the last presidential election without a black candidate.
Using this election as a baseline, the authors find that a Democratic candidate would eke out a win of 279-259 in the Electoral College by flipping Michigan, Pennsylvania, and Wisconsin—states President Trump narrowly won in 2016. Nationally, Democrats would increase their popular vote margin by about 1 point compared with 2016—going from a 2.1-point win to 3.2-point win.
Going out further, Florida is added to the Democratic column by 2024; North Carolina by 2028; and Georgia and Arizona by 2032. Although it doesn’t flip, a Republican candidate would win Texas by just 2.2 points in 2036 under 2016 conditions.
2016: Third party comes home
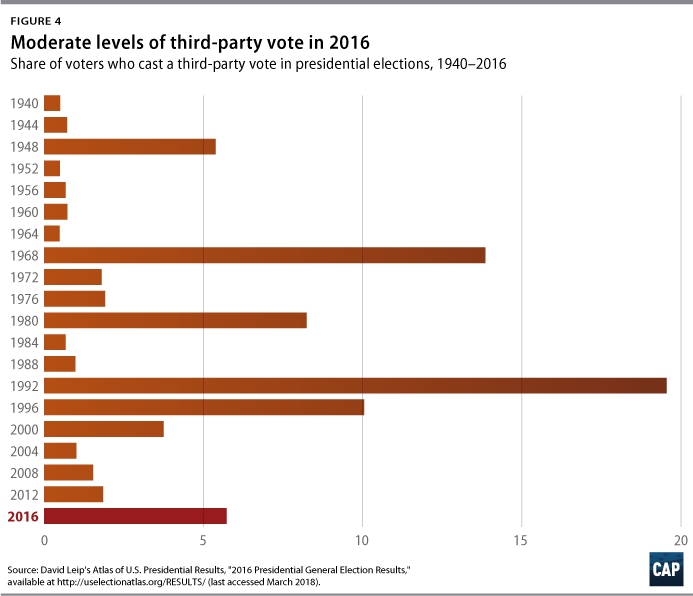
One of the unique features of the 2016 election was the relatively high third-party vote. Nationally, third-party candidates in 2016 collectively garnered about 4 points more than they did in 2012—5.7 percent versus 1.7 percent. While it is possible that similarly high levels of support will appear in future elections, the historical trend would suggest that a decline is more likely after a spike. (see Figure 4) Given that trend, the authors developed a separate 2016 baseline where third-party vote share is returned to its lower 2012 levels and the rest of the third-party vote share is reallocated based on underlying partisan preferences.4
Under this third-party reallocation scenario, the result of projecting forward 2016 voter preferences and turnout is very interesting indeed: an exact tie of 269-269 in the Electoral College in 2020. This is because Wisconsin remains in the Republican column, despite demographic changes.
Even more interesting, the authors believe this 269-269 tie should probably be counted as a Republican win. This is because, while the simulation assigns Maine to the Democrats, it is likely that the GOP might still carry the 2nd Congressional District in the state, based on 2016 voting patterns, which would give them one additional electoral vote—enough to tip the election to the Republicans with a win of 270-268. Moreover, even if the electoral vote was an exact tie, probable Republican advantages in control of House of Representatives delegations—each state delegation gets only one vote—would also likely result in a GOP victory.
Communities of color
Between 2016 and 2036, the authors expect minorities to constitute an additional 10 percent of all EVs—going from 31 percent to 41 percent, respectively. While all of the projections presented in this report reflect this rapidly changing demographic landscape, the following scenarios explore how behavioral changes among these voters might shape future elections.
Equalized turnout
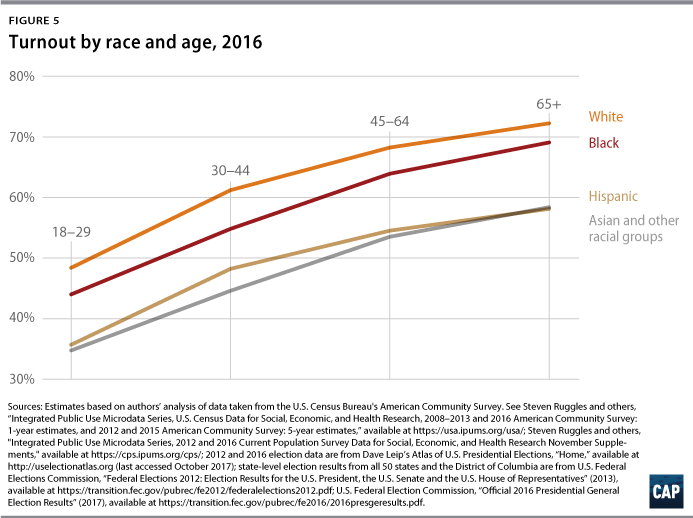
In the modern political era, the turnout rates of black, Hispanic, Asian, and other race voters have typically lagged behind that of whites. According to the report’s analysis, this was true in 2016 among every age group. (see Figure 5) What would be the electoral consequences of closing these gaps, so that turnout within age and education groups was equal across racial categories?
In this scenario, the authors would expect a Democratic win of 288-250 in 2020 as Florida, Wisconsin, and Michigan flip. Nationally, the authors would expect a Democratic candidate to increase their popular vote margin by 1.3 points compared with the 2020 result under the 2016 baseline, going from a 3.2-point win to 4.5-point win.
Unsurprisingly, this Democratic advantage expands the further out the baseline goes. A Democratic candidate could be expected to add Pennsylvania and Arizona to their win column by 2024; Georgia and North Carolina in 2032; and Texas by 2036.
2012 black turnout and support
Two of the biggest changes of political behavior in 2016 were among blacks. First, there was a significant decline in black turnout, dropping close to 4.5 points nationally from the historic highs observed in 2012. Despite growing slightly as a share of EVs, the share of voters who were black dropped by more than 1 point.
In addition, blacks also voted less Democratic and more Republican than usual during the last presidential election. While Democrats enjoyed an 88-point advantage over Republicans in 2016 among black voters, the Democrats’ advantage dropped to 80 points in 2016.
What would happen if black turnout, support, or both returned to their 2012 levels? In all three scenarios, the Democratic candidate would win the Electoral College in 2020—by 294-244, 308-230, and 338-200, respectively—and the national popular vote by 4.1, 4.2, and 5 points, respectively.
In each of the above scenarios, the Rust Belt states of Pennsylvania, Michigan, and Wisconsin swing back into the Democratic column. In addition, increased black turnout flips North Carolina, increased support flips Florida, and increased turnout and support would flip North Carolina, Florida, and—narrowly—Georgia.
Like other simulations, these Democratic win margins expand further into the future. Assuming higher 2012 levels of turnout among blacks, Florida and Georgia flip by 2024, resulting in a 338-200 Democratic win, with Arizona falling into the Democratic column by 2032 for a 350-188 electoral vote advantage. By 2036, Republicans would hold Texas by just 2.2 points.
If black support margins returned to 2012 levels, the authors anticipate North Carolina and Georgia would flip into the Democratic column by 2024, resulting in a 338-200 Electoral College win. This lead expands to 350-188 in 2028 as these states are joined by Arizona. By 2036, Republicans would hold Texas by just 1.8 points.
The same basic pattern is seen if black support and turnout return to their 2012 levels with the sole difference being that North Carolina and Georgia are added not in 2024 but rather in 2020. Under this scenario, Republicans would hold Texas by just 0.4 points in 2036.
Support swings among Hispanics, Asians, and other races
Between now and 2036, the authors anticipate that growth among Hispanics, Asians, and those belonging to other racial groups will drive the diversification of the EV population. Although a number of factors will delay their electoral impact—namely, an age structure that skews younger and an electorally disadvantageous geographic distribution—it is commonly held that both parties will need to garner significant shares of these voters in order to remain viable at a national level.
What would happen over the next 18 years if the Republican Party made significant inroads with these voters? Alternatively, what if the Trump administration’s racially charged policies and rhetoric drive them even further away and create a long-term distrust of the GOP brand?
In the first simulation, Hispanics, Asians, and those belonging to other racial groups swing 7.5 points toward the GOP candidate relative to 2016 levels of support and 7.5 points away from the Democratic candidate—an overall 15-point margin swing. In 2020, this would create a narrow popular vote victory for the Democratic candidate—0.8 points—but a robust 315-223 Republican victory in the Electoral College. Despite demographic changes that generally favor Democrats, the GOP would retain the Rust Belt states of Michigan, Pennsylvania, and Wisconsin, as well as narrowly adding New Hampshire and Nevada to their column. In addition, the GOP win margin would expand to a safer 4 points in Florida and a hearty 12 points in Texas.
Intriguingly, even as their popular vote losses mount in future elections, Republicans still hold the Electoral College by a 283-255 margin through 2028. By that time, they have lost Michigan and Pennsylvania, but still hold states such as Florida, New Hampshire, Nevada, Wisconsin, and North Carolina. However, in 2032, they fall behind the Democrats by losing the latter three states as well as Georgia in 2036 for a final Electoral College deficit of 235-303.
In their second simulation, the authors look at the reverse scenario: the 15-point margin swing among Hispanics, Asians, and those belonging to other racial groups is toward the Democratic Party. In 2020, this produces a significant 6-point popular vote win as well as an Electoral College win of 319-219 for the Democratic candidate—flipping Pennsylvania, Michigan, Wisconsin, Florida, and Arizona. In addition, North Carolina, Georgia, and Texas become narrow Republican wins of 1, 2, and 3 points, respectively, while Nevada, Colorado, and Virginia go Democratic by more than 8 points each.
As with prior scenarios, the electoral map grows more Democratic going out several elections. North Carolina flips by 2024, Georgia and Texas by 2028—producing a 391-147 electoral vote advantage—and by 2036 the Democratic candidate is winning the national popular vote by more than 10 points.
Whites by education
As recently as 1980, whites without college degrees comprised about 70 percent of all EVs—dominating politics nationally and in most states. Rising educational attainment rates and the racial diversification of the electorate have created downward pressure on this group, which constituted just about 46 percent of EVs in 2016; according to the authors’ projections, it should drop another 9.5 points as a percent of EVs by 2036.
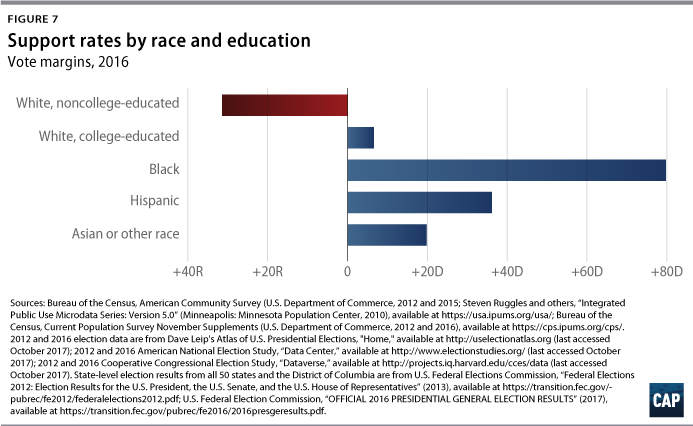
This change is important because of sharp divides in the behavior of whites based on their educational status. In particular, whites without a college degree are notably more likely to vote Republican than other racial groups—a divide that grew in 2016. (see Figure 7) The following section explores what changes among whites with and without a college degree might mean in future elections.
Support swings among white noncollege-educated voters
Despite their demographic decline, whites without a college degree still make up a substantial portion of the voting population. Historically, the national exit polls have been a common data source for understanding the composition of voters, but within the last 10 years it has become increasingly clear that these surveys are underestimating the size of the white noncollege-educated population. The authors’ synthetic data analysis indicates that this group made up about 44 percent of those who showed up at the polls in 2016, compared with 34 percent in the national exit polls.
This finding underscores a great truth: Whites without a college degree are still a massive demographic group and even small shifts in their voting behavior can have dramatic effects on American politics.
In the first scenario, the authors simulate the effect of white noncollege-educated voters swinging a further 5 points toward the Republican Party and 5 points away from the Democrats—a 10-point margin shift overall. For the first time, the Republicans score a popular vote victory in 2020 combined with a robust Electoral College win of 329-209. Besides widening their support considerably in the Rust Belt three of Michigan, Pennsylvania, and Wisconsin, the GOP would add four states to their column: Nevada, Minnesota, Maine, and New Hampshire. Moreover, the Democratic candidate would win Colorado by less than 2 points, as well as Oregon and New Mexico by less than 7 points.
Fascinatingly, in every election thereafter through 2036, Republicans lose the popular vote—and by ever-widening margins—but still win the Electoral College. Nevada flips back into the Democratic column by 2024, but from there on out there is no change in the states until 2036, when the GOP loses Minnesota and Pennsylvania. Even with these losses, the Republican candidate would still win the Electoral College 296-242 in that election.
The authors also explore the reverse scenario: where white noncollege-educated voters swing toward the Democratic Party. This produces an incredibly robust win for Democrats in 2020, taking back the Rust Belt three, namely Michigan, Pennsylvania, and Wisconsin; carrying Florida by 4 points; getting narrow wins in North Carolina and Arizona; and squeaking out a victory in Georgia by less than one-tenth of a point. Republican margins in Ohio, Iowa, and Texas are also whittled away, moving them into swing state territory. Overall, Democrats would carry the popular vote by more than 7 points and the Electoral College by 350-188.
While the popular vote margin expands heading out several more elections, the Electoral College totals are steady until 2036. At this point, Texas and Ohio would flip, resulting in a 408-130 Democratic win.
Another possibility is that the big change in 2020 may be education-based trends sliding back to previous levels. In a scenario where GOP white noncollege-educated voter margins return to 2012 levels, Democrats would enjoy a strong 5.6-point popular vote advantage in 2020 and garner a dominant 347-191 electoral vote win. Besides gaining back the Rust Belt three plus Iowa by healthy margins, the Democrats would carry Florida, North Carolina, and Ohio—albeit all by under 1 point. Looking further out, Democrats would retain the same coalition through 2032 without gaining a state. In 2036, they would add Arizona and Florida for a final tally of 373-165.
Support swings among white college graduate voters
While smaller than their noncollege-educated counterparts, whites with a college degree are still an important demographic group. They are about 22 percent of EVs but, due to their high levels of turnout, constitute 29 percent of actual voters. In fact, without this group, whites would actually be underrepresented among voters rather than overrepresented. What would happen if the voting behavior of this group shifts significantly in the next several elections?
The first scenario simulates the effect of white college graduate voters swinging 5 points toward the Democratic Party and 5 points away from Republicans—a 10-point margin shift overall. In 2020, the Democratic candidate would achieve a 334-204 Electoral College victory while handily winning the popular vote by more than 6 points. The Democrats would move the Rust Belt three decisively back into their column; carry Florida by 2 points; and squeak out victories in North Carolina and Arizona by less than 1 point. Republicans would win Georgia by just 1 point, and Iowa, Ohio, and Texas would move into swing territory.
Going further out, Democrats’ electoral vote advantage rises to 350-188 in 2024 as they pick up Georgia and stays at that level until 2036 when they add Texas for a 391-147 win.
The reverse scenario—where Republicans do better among whites with college degrees and Democrats do worse—is a favorable scenario for the GOP if not quite as good as a similarly sized swing in their favor among white noncollege-educated voters. Even though they would narrowly lose the popular vote in 2020, Republicans would nevertheless achieve a 323-215 electoral vote victory. They would retain all the states they carried in 2016 plus add Maine, Minnesota, and New Hampshire to their column. In addition, Colorado and Nevada would go Democratic by only slightly more than 1 percentage point.
Although the Republican popular vote deficit would widen in every subsequent election, they would win the Electoral College up until 2036. By 2028, Maine and Minnesota would flip back into the Democratic column, resulting in a 311-227 Republican win. This would be followed by the loss of Pennsylvania in 2032—reducing the Republican margin to 292-246—and bottom out in 2036 as Michigan, Florida, North Carolina, and Georgia all flip for a 324-214 Democratic victory.
In a scenario where Democratic white college graduate margins reverse trend and simply revert to 2012 levels, Democrats would receive only a 1.3-point popular vote advantage in 2020—not a Republican popular vote victory, but still quite a bit smaller margin for the Democrats than most other scenarios. And Republicans, despite losing the popular vote, would still pull out a narrow electoral vote victory of 273-265 in 2020. They would gain New Hampshire and keep Wisconsin, while losing Michigan and Pennsylvania by 2 points and 1 point, respectively. Moreover, Republicans would retain this electoral vote majority through 2028, before losing 292-242 in 2032, subtracting Florida, and 302-236 in 2036, subtracting Wisconsin.
Voter group trade-off scenarios
So far, each of the authors’ simulations has involved changing one thing about the electorate while keeping others stable—turning one knob at a time, if you will. However, the electoral calculus played by parties is rarely so clear-cut and often involves trade-offs. This section explores what would happen if gains made in one part of the electorate were coupled with losses elsewhere and how these exchanges might influence the decisions made by Democrats and Republicans over the next 18 years.
Hispanics, Asians, and other races traded for white noncollege-educated voters
What if the GOP successfully appealed to Hispanics, Asians, and those belonging to other racial groups—gaining a 15-point margin swing—but at the same time lost white noncollege-educated voter support, pushing the margins among that group back to 2012 levels?
On net, this trade-off does not benefit the GOP in 2020, as they narrowly lose the Electoral College 279-259. This is because they only pick up Nevada relative to 2016 while ceding back to the Democrats four Midwest and Rust Belt states—Iowa, Michigan, Pennsylvania, and Wisconsin—by 4 points or more. Nationally, the 3.2-point popular vote win for Democrats under this scenario is about the same as the one predicted by the 2016 baseline scenario, which assumes stable electoral behavior.
The Democratic win in the Electoral College rises to 291-247 as North Carolina flips in 2024, followed by Nevada in 2028 and Ohio in 2036, for a final electoral vote tally of 314-224.
White college graduates traded for white noncollege-educated voters
One of the most notable features of the 2016 election was the widening gap between the vote choices of whites with and without a college education. What if this gap continues to grow through movement at both ends of the educational spectrum, as it did in 2016?
This next scenario models this by combining a 5-point margin swing toward the GOP among white noncollege-educated voters with a 5-point margin swing toward the Democrats among white college graduates. On balance, the Republican Party would benefit from this trade-off in 2020 by flipping New Hampshire, increasing their electoral vote advantage to 309-229.
Under this scenario, the Republican candidate in 2024 would hang on to the Electoral College victory from 2020 despite losing the popular vote by almost 4 points. They barely scrape by at 273-265, as New Hampshire, Pennsylvania, and Michigan are subtracted from their coalition. After that, their outcomes go south pretty rapidly, as the Republicans lose Wisconsin, Florida, and North Carolina in 2028 for a 216-322 Electoral College loss, followed by losing Georgia in 2032 and Arizona in 2036, for a final 188-350 disadvantage.
White college graduates, Hispanics, Asians, and other races traded for white noncollege-educated voters
Another possibility is that white noncollege-educated voters shift toward the Republican Party in a 10-point margin swing, while white college graduates and Hispanics, Asians, and those of other racial groups move toward the Democratic Party with 10-point and 15-point margin swings, respectively. Here Democrats attain a 309-229 electoral victory in 2020, by taking four new states by narrow margins: Pennsylvania, Michigan, Florida, and Arizona. In addition, the Republican candidate would win several states—Wisconsin, Georgia, North Carolina, and Texas—by less than 5 points. Nationally, the Democrats wind up with a 5-point popular vote advantage.
In 2024, Democrats add Wisconsin and North Carolina for a 334-204 Electoral College win. Georgia and Texas join these states in 2028 for a final 391-147 advantage that holds out to 2036.
Conclusion
This report has assessed the potential electoral effect of shifting race, age, and education demographics under a variety of different scenarios. It is clear that this effect is likely to be significant but that neither party can be assured of long-term dominance simply from shifting demographics. Indeed, the simulations in this report also show the potentially strong effect of shifts in party preference and turnout among various demographic groups.
As a result, both parties will have considerable work to do in order to adjust to the changing structure of the eligible electorate. While shifting demographics favor Democrats when all else is held equal, the party has significant vulnerability among aging white voters, who will remain quite important in slow-growing Midwestern and Rust Belt swing states. Democrats will therefore have to think hard about how to balance appeals to their growing base among voters of color and younger generations with outreach to older white voters—particularly in Middle America.
On the other hand, Republicans face a clear need to enhance their appeal to America’s rapidly growing communities of color—especially Hispanics and Asians. If they do not, Republicans risk putting themselves into a box where they become ever more dependent on a declining white population—particularly its older segment. As the simulations show, GOP electoral fortunes could be linked to a strategy where they repeatedly lose the popular vote but, based on larger advantages among white—particularly white noncollege-educated—voters, pull the electoral vote rabbit out of the hat anyway. This could work for a time, though ultimately it, too, would be undermined by shifting demographics. The prudent course may very well be to adapt now, rather than later, to onrushing demographic change. If nothing else, it would give the party more options going forward.
Methodology
EV projections
All of the data presented on EVs in this report are projections that are based on the EV projections laid out in the States of Change report,5 up-to-date demographic profiles from the 2016 one-year American Community Survey (ACS), and a demographically based educational projection model.
The first step in this process was taking data from multiple years of the ACS—2008 to 2013—and dividing up the American population into groups based on state, race, age, and their level of educational attainment: for example, Hispanics ages 30 to 44 in Colorado with a college degree. We then used multilevel statistical models to estimate the unique education rates, the rate of college education among a given group, and attainment rates, the rate at which these groups gained education over time, for each state, race, and age group. Using the original States of Change EV projections as a baseline, these groups were then tracked forward in time and had those unique attainment rates applied to them as they moved into older age groups. Additionally, our estimates account for the influx of migrants and immigrants into each state, race, and age group, as well as the effect it has on those groups’ overall education level. Note, however, that we assumed that entering cohorts would complete college educations at the same rate as the most recent cohorts completed them—an assumption that may bias our overall change results downward, since that assumption does not correspond to recent trends.
The final estimates were updated with the latest demographic data—using state-level demographic profiles from the 2016 one-year ACS. The demographic composition of each state’s EV population in 2016 was set equal to the levels observed in that data and then had the rates of change from our initial projections applied to them for each subsequent election year.
The end result of the process employed in this paper is EV composition projections—by state, race, age, and education—that are baselined off of the most recent demographic data available, sensitive to likely increases in the educational rates of the U.S. population that will occur due to group-specific increases in education over time, immigration rates, and migration rates. In addition, it accounts for changes to the racial and age composition of the EV population that we are likely to observe in each state over coming election cycles.
Turnout and support estimates
For this project we developed original turnout and support estimates by combining a multitude of publicly available data sources. We did this in order to deal with what we believe are systematic problems with some of the most widely available and widely cited data about elections.
One of the underappreciated problems in the world of election analysis is that some of the most reliable sources of data available on demographics, turnout, and support do not play very well together. For example, if we combine some of the best data we have on demographics with the best data we have on turnout, we find that they vary from the actual levels of turnout observed on Election Day. Furthermore, if we combine those data with the best data we have on vote choice, we get election results that do not line up with reality.6 This is not due to any one source of information being particularly biased; rather, each has points of weakness.
Our goal was to do better. To deal with these issues we had three guiding principles:
- Incorporate as much information from as many sources as possible.
- Lean on the strengths of individual data sources while accounting for their weaknesses.
- Make sure that our results matched up with election results from the real world.
For our analysis, we broke the U.S. population down into 32 demographic groups: four racial categories—white, black, Latino, and Asian and other races; four age groups—18 through 29, 30 through 44, 45 through 64, and 65+; and two education groups—people with a four-year college degree and people without a four-year college degree. The product of this analysis is the following for each of those 32 groups:
- County-level estimates of EV composition
- County-level turnout estimates
- County-level estimates of voter composition
- County-level party support estimates
These estimates are fully integrated with one another and, when combined, recreate the election results observed in 2012 and 2016. Below is a more detailed description of how each was created.
County-level EV composition
We started off our process by collecting detailed demographic data at the county level from the U.S. Census Bureau’s ACS. The goal of this process was to produce reasonable estimates about the composition of EVs within a given county. Specifically, we wanted to know how many EVs in each county fell into each our 32 demographic groups.
Here we ran into our first problem: Data this detailed aren’t available at the county level. For example, data on the race and age distribution as well as data on the age and education level distribution within a county are available separately. However, there aren’t data available on the race-, age-, and education-level distribution.
To overcome this problem, we employed a two-stage estimation process. First, we collected these disparate pieces of data on race, age, education level, and citizenship from the 2012 five-year and 2015 five-year ACS. We then used iterative proportional fitting (IPF) to make these various pieces of data that are available line up with one another. IPF is a form of adjustment that allowed us to make individual group counts—for example, the number of EVs in a county who are black, 18 through 29 years old, and have a college degree—line up with known population margins, such as the number of EVs who are black and have a college degree; the number of EVs who are ages 18 through 29 and have a college degree; and the number of EVs who are black and ages 18 through 29.
At this point in the process, we had estimates on the EV composition of each county, but there were several notable problems. First, the use of the five-year ACS was necessary in order to obtain estimates for every county in the United States, but it provides a somewhat blurry image of the year in question. Data from the 2012 five-year ACS are an amalgamation of data from 2007 through 2012, while 2015 data are from 2011 through 2015. In short, the ACS provides the necessary coverage but at the expense of giving us an accurate picture of the population as it existed in the year in question.
Second, the IPF process tends to spread certain characteristics—say, citizenship—somewhat indiscriminately across groups so long as the totals line up with other margins. This is particularly problematic for something like education groups where—outside of the non-Hispanic white population—we see different rates of citizenship.
Third, the IPF process inevitably generates estimates that are logically consistent within a county given the margins that have been provided but does not collectively add up to the number of people one can expect to belong to a given group in a state.
To address all three problems, we included an additional corrective step. Using the individual-level data from the 2012 and 2016 one-year ACS, we could accurately estimate the real state-level race, age, and education level composition of EVs. Logically, the numbers of EVs who fall into our 32 groups in the counties must add up to the number observed at the state level. We once again employed IPF to make the frequencies in the counties collectively line up with the frequencies at the state level. These were used as our final estimates for EV composition in each county.
County-level turnout rates
The process of creating county-level 2012 and 2016 turnout rates for each of our 32 demographic groups began by generating state-level estimates for these groups. Using data from the 2012 and 2016 November Supplement of the Current Population Survey (CPS), we ran cross-nested multilevel models that estimated the turnout rate for each year, state, race, age, and education level group represented in the data. Many of these groups can be very small, but this approach provides more realistic starting estimates of turnout for low-sample populations by partially pooling data across individuals’ geographic and demographic characteristics.
We then fed those state-level turnout estimates into the EV counts we generated in the previous step. This provided us with an initial estimate of how many people turned out to vote in a particular county in each year. At this point the difficulties we previously described became apparent: The estimated number of voters from a given county will inevitably deviate from the real number who voted. Once again, we employed IPF at the county level to force these counts to match up with one another, increasing or decreasing the turnout rates for our 32 groups until the two aggregate vote counts aligned.
That said, it is worth discussing how we use and think about these estimates. While we did generate county-level turnout rates that accurately recreate the aggregate turnout numbers observed in each county, there’s good reason to believe that they contain error. Instead of treating the numbers as completely accurate, we view this process as something that helps us generate more precise state-level estimates.
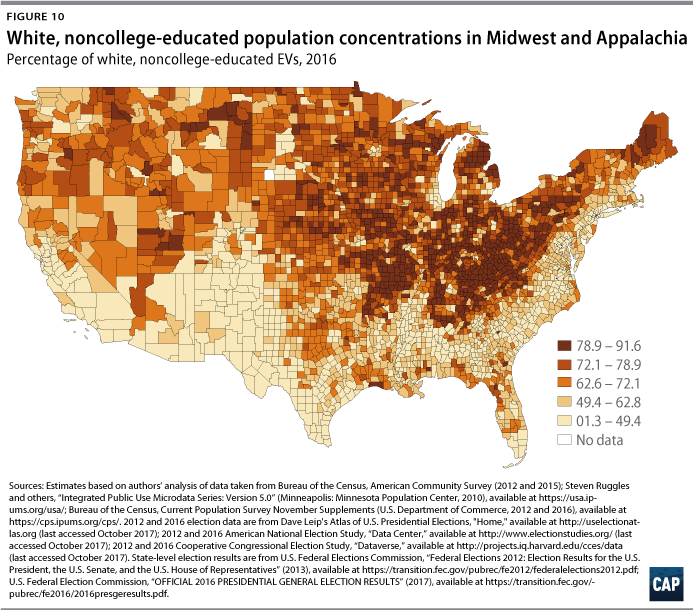
This process takes advantage of geographic segregation at the county level to selectively adjust turnout rates between demographic groups rather than applying a blanket correction at the state level. Looking at Figure A1—which shows the share of EVs in each county who are white and do not have a college degree—we can see that there are some places where more than 80 percent of the population falls into that demographic category. To the extent that our 32 demographic groups are nonrandomly distributed across a state, this process will selectively push and pull their turnout rates. While the estimates within any given place may be off, we believe this discriminatory adjustment provides a better state-level picture.
These county rates are aggregated to the state level and applied to the demographic projections for each scenario.
County-level party support estimates
The process of creating county-level 2012 and 2016 Democratic and Republican support rates for each of our 32 demographic groups began by generating state-level party support estimates for these groups. Using publicly available data from the American National Election Studies and the Cooperative Congressional Election Study in 2012 and 2016, as well as one of the postelection surveys from 2016 by Center for American Progress, we ran cross-nested multilevel models that estimate the party support rates for each year, state, race, age, and education group represented in the data. Many of these groups can be very small, but this approach provides more realistic starting estimates of party support for low-sample populations by partially pooling data across individuals’ geographic and demographic characteristics.
We then fed those state-level support estimates into the voter counts we generated in the previous step. This provided us with an initial estimate of how many people voted Democratic, Republican, and third party in a particular county in each year. Once again, the difficulties we described became apparent—the estimated number of Democratic, Republican, and third-party votes from a given county will inevitably deviate from the real election results. We employed IPF at the county level to force these counts to match up with one another, increasing or decreasing the support rates for our 32 groups until the aggregate vote counts aligned.
That said, it is worth discussing how we use and think about these estimates. While we did generate county-level support rates that accurately recreate the aggregate election results observed in each county, there is good reason to believe that they contain error. Instead of treating the numbers as completely accurate, we view this process as something that helps us generate more precise state-level estimates than previous methodologies.
We see the strengths and weaknesses of this process in the same light as we previously described in the turnout explanation above. Geographic segregation at the county level lets us selectively push and pull the support rates of our groups around rather than applying a blanket correction at a higher geographic level. The estimates within any given place may be off, but we believe this discriminatory adjustment provides a better state-level picture.
These county rates are aggregated to the state level and applied to the demographic projections for each scenario.
Appendix
About the authors
Robert Griffin is the associate director of research at the Public Religion Research Institute, focusing on demographic change and American political behavior. He is the co-author and lead data analyst for the States of Change project. He is also an active member of the Democracy Fund’s Voter Study Group—a cross-institutional collaboration to study changes in the political behavior and beliefs of Americans. He has taught courses on research methodology, statistics, public opinion, and political advocacy for The George Washington University, Pennsylvania State University, and Loyola University Chicago.
Ruy Teixeira specializes in the study of demographic change, voting behavior, and public opinion. He is a senior fellow at both The Century Foundation and the Center for American Progress and a co-director of the States of Change project. His new book is The Optimistic Leftist: Why the 21st Century Will Be Better Than You Think. His other books include The Disappearing American Voter; America’s Forgotten Majority: Why the White Working Class Still Matters; The Emerging Democratic Majority; and Red, Blue, and Purple America: The Future of Election Demographics.
William H. Frey is an internationally regarded demographer, known for his research on urban populations, migration, immigration, race, aging, and political demographics, as well as his expertise on the U.S. census. He is a senior fellow at the Brookings Institution, a research professor in population studies at the University of Michigan, and a co-director of the States of Change project. His new book is Diversity Explosion: How New Racial Demographics are Remaking America.
Acknowledgments
We would like to thank the William and Flora Hewlett Foundation and the Democracy Fund for their generous support of this project and our board of advisers for helping shape the direction and output of the project. We would also like to acknowledge some of the numerous people who helped us conduct this research and produce this report. They include: John Fortier, Matthew Weil, Michael Thorning, and Brenna McAfee at the Bipartisan Policy Center and Karlyn Bowman of the American Enterprise Institute for valuable input and guidance; Cathy Sun of the University of Michigan Population Studies Center for programming our original projections; David Lanham of the Brookings Institution and Allison Preiss of the Center for American Progress (CAP) for publicity; Lauren Vicary, Carl Chancellor, and Shanée Simhoni of CAP for report editing; Chester Hawkins and Bill Rapp of CAP for report graphics; and, more generally, the entire Editorial and Art team at CAP for their excellent production work.
Correction, April 24, 2018: Figures 6 and 8 have been updated to accurately represent voting projections in 2020 and 2036.