Authors’ note: CAP uses “Black” and “African American” interchangeably throughout many of our products. We chose to capitalize “Black” in order to reflect that we are discussing a group of people and to be consistent with the capitalization of “African American.”
Introduction and summary
The state of the teaching profession is an urgent topic for policymakers and the public, especially against the backdrop of increased teacher strikes and walkouts across the country in the past two years.1 Teacher salaries are far too low, which has led many teachers to work second jobs or qualify for public assistance programs such as the Supplemental Nutrition Assistance Program (SNAP).2 For the first time in years, a majority of parents surveyed by PDK International in 2018 said that they do not want their children to become teachers.3 Due to low salaries, difficult working conditions, and a lack of career pathway opportunities, the teaching profession as a whole cannot compare with other high-status professions such as medicine and law.4
Even as teacher wages stagnate and state investment in education declines, teachers are being asked to do more than ever—and enrollment in teacher preparation programs is decreasing significantly nationwide.5 This decline has spurred discussion among policy experts about how policymakers should address this issue and whether the decline in enrollment has already or will likely lead to national teacher shortages.6
So far, the conversation on falling teacher enrollment has focused largely on this second issue. However, little is known about why enrollment is declining; whether certain groups of students have been shying away from enrollment in preparation programs more than others; and whether the decline is worse in certain subject areas, geographic areas, or types of programs. This lack of detailed information prevents policymakers from developing targeted, effective solutions and could result in a misplaced focus on certain aspects of the problem that ignores more pressing issues.
What is known is that since 2010, total enrollment nationwide in teacher preparation programs has declined by more than one-third; this decline has occurred in the context of increasing enrollment in bachelor’s degree programs nationwide over the same time period.7 This means that across the country, approximately 340,000 fewer students elected to enroll in teacher preparation programs in the 2016-17 academic year—the latest year for which data are available—compared with the number of students who enrolled in 2008-09.8 Similarly, there was a 28 percent decline in the number of students completing teacher preparation programs in the same years.
However, these national figures tell a limited story. Teacher labor markets are hyperlocal, with most teachers choosing to work within 15 miles of their hometowns.9 By examining state-by-state and even institution-by-institution information, policymakers can go beyond top-line national numbers to learn more about the trends in enrollment in each state. As Congress considers reauthorizing the Higher Education Act (HEA) in the coming months, policymakers should add reporting requirements that would enable them to better understand declining enrollment in preparation programs and teacher labor markets more broadly.
This report provides a deeper analysis of those enrolled in and completing teacher preparation programs in the hopes that this new information will help policymakers both create policy and understand areas where further information is needed in order to make informed decisions. This deeper analysis includes information on aspects of teacher preparation program enrollment and completion that are particularly relevant to policymakers, such as racial and ethnic diversity of students, gender diversity of students, and the subjects in which students seek certification.
Many policymakers are currently interested in increasing the racial diversity of the teaching profession, which is important for all students but particularly students of color.10 Currently, 80 percent of K-12 teachers in the United States identify as non-Hispanic white; 9 percent identify as Hispanic; 7 percent identify as non-Hispanic Black; and 2 percent identify as non-Hispanic Asian.11 The teacher workforce is less racially diverse than the overall U.S. labor force, which is 78 percent white, 13 percent Black, 17 percent Hispanic or Latino of any race, and 6 percent Asian.12
Research demonstrates that Black students taught by same-race teachers experience benefits as far-reaching as improved academic achievement, greater educational attainment, and higher academic aspirations. Although there is less research on the benefits of same-race teachers for Latinx students due to small sample size, there is reason to believe that the same effect would hold true.13 Likewise, it is important for all students, not just students of color, to see racially diverse teachers in leadership roles in their schools. Yet previous research estimated that 40 percent of schools in the United States do not have any teachers of color on staff.14 More recent data suggest that teachers of color remain more likely to teach in urban schools and in schools where a greater percentage of students are eligible for free or reduced-price lunch.15
A less-researched aspect of diversity in the teaching profession is gender diversity. The teacher workforce is majority female, at 77 percent.16 This dearth of male educators has consequences for both teachers and students. Research shows that when women represent the majority in a profession or field, overall pay declines;17 historian Dana Goldstein documented this process in detail for the teaching profession in her book The Teacher Wars.18 While claims of a crisis in boys’ education may be overblown,19 having both male and female teachers is likely good for students for many of the same reasons that they benefit from a racially and ethnically diverse teacher workforce. Many Black male educators, who comprise only 2 percent of the K-12 teaching force, have written compellingly about the importance of increasing their numbers in the profession.20
In addition to encouraging a more diverse teaching profession, policymakers should also address teacher shortages. While there is some debate and skepticism about reports of a national teacher shortage21—the United States may even graduate too many teachers in certain fields, such as elementary education22—there are demonstrable and persistent teacher shortages across the country in high-demand fields and subjects.23 These areas include science, math, special education, and English-language learners.24 If the overall decline in interest in preparation programs hides an even steeper decline of teachers who are interested in these high-need subjects and fields, it is critical that policymakers target solutions to address the issue.
Another aspect of this analysis that will interest policymakers is the author’s finding that there are several large teacher preparation programs that are part of the for-profit sector, including those not affiliated with IHEs—a type of program that has seen explosive growth in recent years. For many years, the broader for-profit higher education sector has been the subject of intense scrutiny as a result of poor student outcomes and deceptive practices.25 Students who attend these schools have high default rates,26 are less likely to be employed, and have lower earnings than students who attend public institutions; this disparity in employment and earnings grows even larger for students who attend for-profit colleges that are largely online.27 The HEA does not require programs to specify in their Title II reporting to the U.S. Department of Education whether a preparation program is part of a for-profit entity, so it is unclear how prevalent for-profit IHEs are in teacher preparation. However, the in-depth state profiles in a later section of this report show that for-profit programs that are not affiliated with an institution of higher education are large and growing quickly in some places.
This report provides a thorough and localized descriptive analysis of teacher preparation enrollment and completion trends and proposes that policymakers collect and analyze more data in order to pursue more targeted, informed policy solutions. The key findings of this analysis are as follows:
- Nationally, there were more than one-third fewer students enrolling in teacher preparation programs in 2018 than in 2010. Nearly every state in the nation has experienced declining enrollment in teacher preparation, with some states experiencing drastic declines of more than 50 percent.
- From 2010 through 2018, there was a 28 percent decline in students completing teacher preparation programs. Data on individuals completing teacher preparation programs reveal that from 2003 through 2013, there were more than 200,000 students completing teacher preparation programs; in 2018, however, fewer than 160,000 students completed such programs.
- Contrary to the overall decline in enrollment in other types of preparation programs, alternative preparation programs that are not based at IHEs experienced an increase of more than 40 percent in enrollment between 2010 and 2018. Increasing enrollment in this type of program drove a slight uptick in national enrollment between 2016 and 2018.
- Disaggregating enrollment data by race and ethnicity shows that one-quarter fewer Black and Latinx teacher candidates were enrolled in teacher preparation programs in 2018 than in 2010. Enrollment declined by more than half for those who identified as Native Hawaiians or Pacific Islanders and American Indian or Alaska Native.
- When looking at enrollment by gender, the national percentage declines in enrollment were similar for male and female candidates, although the decline was steeper for men in most states.
- Programs for subjects with persistent teacher shortages, such as science, technology, engineering, and math (STEM) and special education, experienced declines in completion from 2012 to 2018. However, these declines were lower than the national decline in completers during the same time period. Notably, there was a 30 percent increase in completers who earned credentials for teaching English-language learners or bilingual education.
- At the national level, it remains difficult to estimate whether the total number of teacher preparation program completers is enough to fill the current need for new teachers. This is even more difficult to determine on a state-by-state basis due to the insufficient data currently collected.
These findings identify several specific and troubling trends that policymakers must address. They also demonstrate that there is still much to understand about certain aspects of teacher preparation programs. The final section of this report provides policy recommendations for the federal government and states on how to provide greater oversight of the non-IHE alternative certification sector and how to gather and report more data on teacher preparation programs and teacher labor markets. Specifically, policymakers should gather and report these data in the following ways:
- Through HEA Title II reporting, the federal government should disaggregate data for both enrollees and completers by race, ethnicity, and gender.
- Through HEA Title II reporting, the federal government should collect cohort graduation rates of teacher preparation programs.
- Through HEA Title II reporting, the federal government should collect information on whether programs are for profit and whether they are primarily online. These categories should be defined in a way that is consistent with other higher education data reporting.
- The federal government should expand data collection on additional indicators of teacher supply and demand.
- States should collect and report information on their teacher supply and demand with support from the federal government.
- States should approach the for-profit non-IHE alternative certification sector with appropriate skepticism and resist opening the floodgates to new, for-profit non-IHE alternative certification programs.
- States should use improved data collection to develop targeted solutions to improve teacher preparation and modernize and elevate the teaching profession.
A note on the data source
Since the reauthorization of the Higher Education Act in 2008, every teacher preparation program in the nation that receives federal funding—including those that provide alternative routes to certification—has been required by Title II to report on a number of metrics to the state, which in turn reports the information to the federal government.28
The data reported include enrollment numbers broken down by gender, race, and ethnicity; entry and exit requirements for programs; completion numbers; and the subjects or certification areas in which enrollees are being prepared to teach, among other information.29 The author analyzed these data at the state level using descriptive statistics to better understand the trend of declining enrollment in teacher preparation.
All data in this report are referred to by the year reported—one year after the academic year they were collected—which is consistent with the way the data are presented by the U.S. Department of Education. The latest data currently available as of the writing of this report are from the 2016-17 academic year, reported in 2018. Some data are available in earlier years than others. Data on completers of teacher preparation programs are available as early as reporting year 2001. Data on enrollment—including data disaggregated by race, ethnicity, and gender—are available back to reporting year 2010. Data on students prepared by subject area are available back to reporting year 2012. The author strove for consistency in presentations of percentage changes, so most of the figures displaying percentage change in this report are for reporting years 2010 to 2018 and are clearly labeled in all cases. Where the author was able, efforts were made to use the full range of data years, as in Figure 3 for completion, which presents data from reporting years 2001 to 2018.
In this report, “enrollment” in a given year refers to all of the students who were enrolled for that academic year, including students who completed during that same year. This is slightly different than how these data are presented on the HEA Title II webpage—where enrollment and completion are shown as two separate categories—but better reflects a common understanding of enrollment as everyone who attended the program in a particular year. This decision was made based on advice from the Title II Support Center, which administers the dataset for the Department of Education.30 For more detailed information on how the author made these calculations, please see the appendix.
Results of the analysis
Since the federal government began collecting relevant data in 2010, the overall trend of enrollment in teacher preparation programs has been a decline, with more than one-third fewer students enrolling in preparation programs in 2018 than in 2010. While there was a slight uptick in national enrollment in 2017 and 2018, the overall downward trend still dwarfs this recent bump. (see Figure 1)
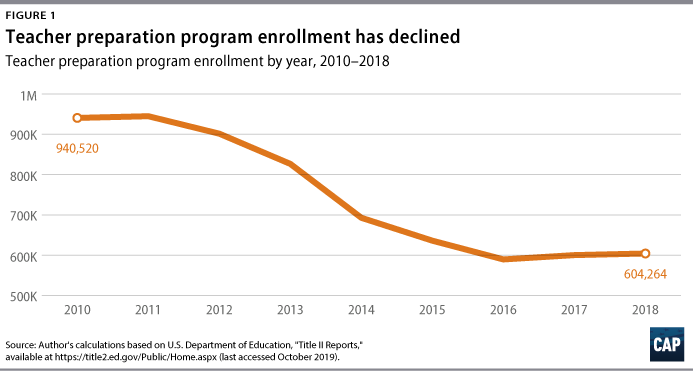
Moreover, as later figures illustrate, the bump in enrollment in 2017 and 2018 was entirely due to an increase in enrollment in alternative certification programs not located within IHEs. While enrollment in traditional preparation programs has declined every year since 2012, alternative, non-IHE preparation programs increased their enrollment by more than 30,000 teacher candidates from 2016 to 2017—an increase of more than 50 percent in one year—and by an additional 4,700 students from 2017 to 2018.
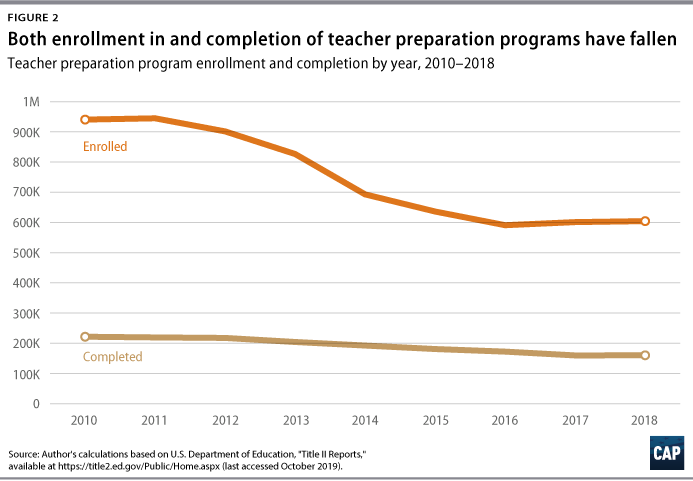
Changes in the number of students completing teacher preparation programs are also an important data point to indicate the potential supply of new teachers. As shown in Figure 2, the decline in students completing teacher preparation programs is less drastic than the decline in enrollment but is still substantial at 28 percent.
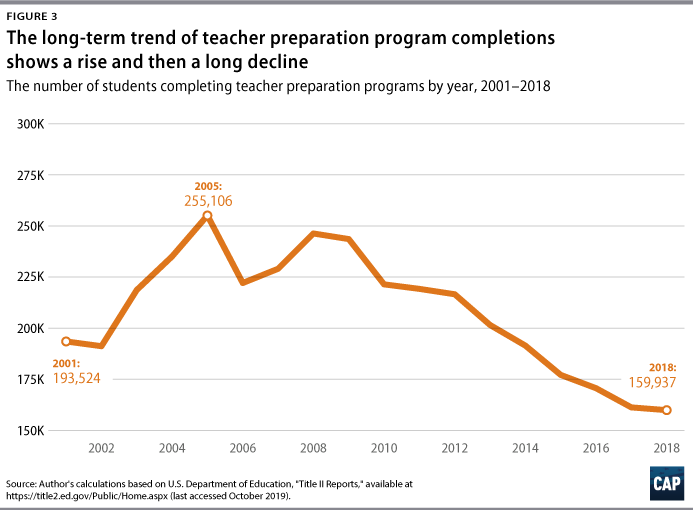
Data on the number of students completing teacher preparation programs go back to 2001 and suggest that the recent decline may be due in part to an adjustment to several years in the early 2000s in which the number of completers was especially high. (see Figure 3) Unfortunately, data on enrollment are not available for this time period for comparison. Although the number of completers declined starting in 2008, it was not until 2014 that it reached the low experienced in 2001. For context, the number of bachelor’s degrees conferred in the United States rose consistently each year during this time period—from 1.2 million in the 1999-2000 academic year to nearly 2 million in 2016-17.31
Enrollment in teacher preparation programs has declined in nearly every state
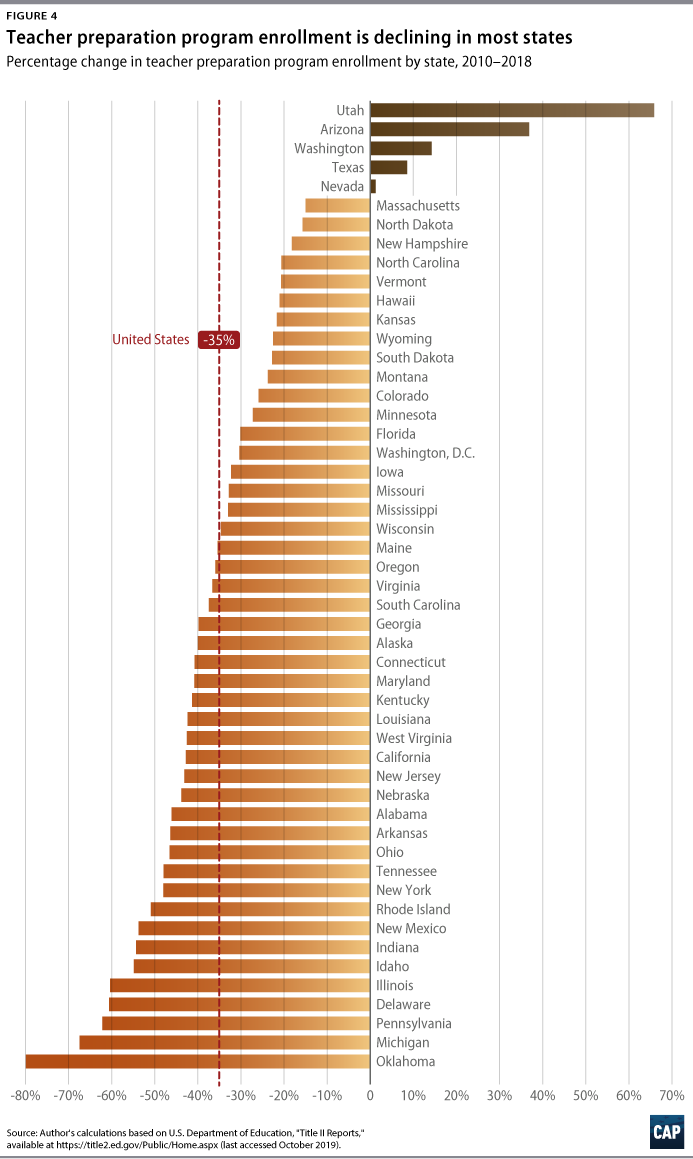
The decline in students enrolling in preparation programs varies significantly by state. (see Figure 4) While the decline has been less drastic in some states, nine states have seen enrollment decline by 50 percent or more: Oklahoma at 80 percent, Michigan at 67 percent, Pennsylvania at 62 percent, Delaware at 61 percent, Illinois at 60 percent, Idaho at 55 percent, Indiana at 54 percent, New Mexico at 54 percent, and Rhode Island at 51 percent.
In nine states—New York, Pennsylvania, Illinois, California, Oklahoma, Michigan, Ohio, Indiana, and New Jersey—the decline in enrollees was more than 10,000 from 2010 to 2018. Many of the states with the largest absolute declines are among the most populous in the nation, but a few very populous states such as Texas and Florida are notably absent from this list.
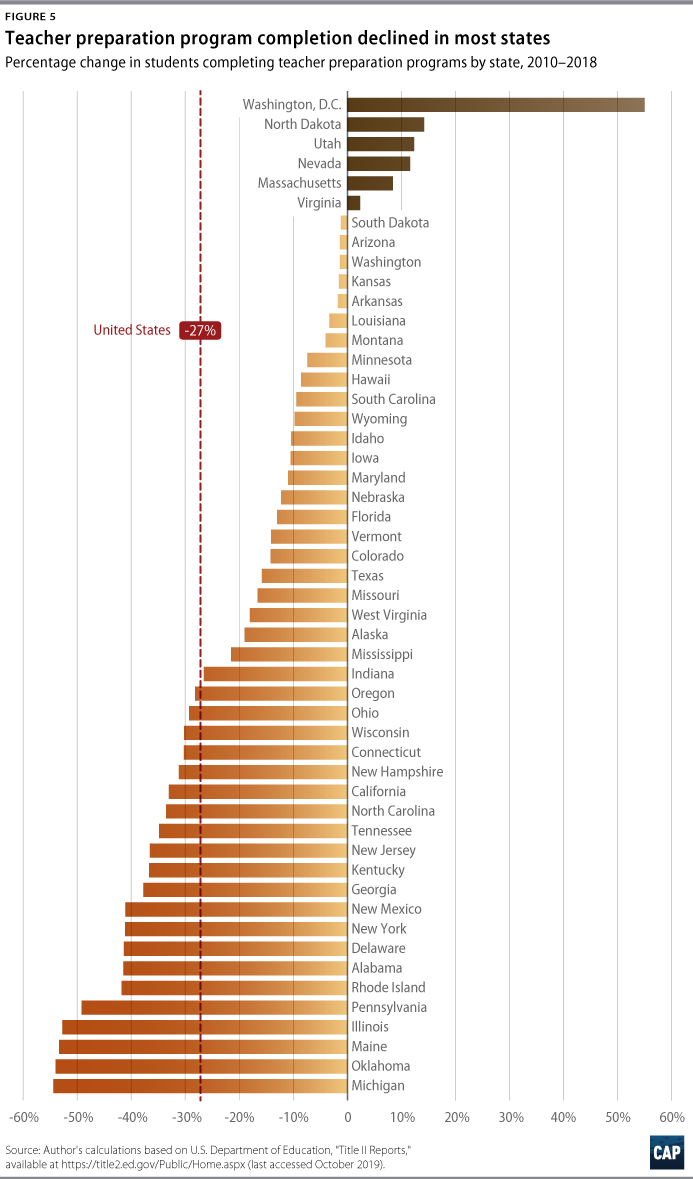
The number of students completing teacher preparation programs has declined in nearly every state
Figure 5 shows that the trend for completers of teacher preparation programs looks much like that of enrollment, with most states experiencing a decline. However, the declines in completers are less drastic than the declines for enrollment. Only four states had a 50 percent or greater decline in the number of teacher preparation program completers from 2010 to 2018: Michigan at 54 percent, Oklahoma at 54 percent, Maine at 53 percent, and Illinois at 53 percent. The states with the largest absolute decline in completers were New York, Pennsylvania, California, and Illinois, which each lost more than 5,000 completers from 2010 to 2018. Virginia, Massachusetts, Nevada, Utah, North Dakota, and the District of Columbia were the only places where the number of students completing teacher preparation programs increased.
Traditional teacher preparation programs are experiencing the most consistent decline in enrollment of all program types
Each preparation program in this dataset is identified as traditional; alternative, IHE-based; or alternative, not IHE-based, as defined by the state in which it is located. Most teachers are prepared through traditional routes: In 2018, 77 percent of enrollment was in traditional teacher preparation programs. However, while these programs still enroll the majority of prospective teachers across the nation, non-IHE alternative certification programs have seen large enrollment growth.
Traditional teacher preparation programs are typically based at a postsecondary IHE, which can be public, nonprofit, or for profit. They often constitute a major or pathway that is part of a bachelor’s degree or master’s degree; less commonly, some programs offer students a five-year combined bachelor-master’s degree. Teachers who graduate from these programs do not start teaching until they have finished all of their certification requirements.32
Alternative certification programs are typically designed to provide individuals who already have a bachelor’s degree with an alternative pathway to certification and licensure that does not require them to obtain another bachelor’s degree. In these programs, candidates begin teaching before completing all of their certification requirements. Alternative certification programs can be run by a postsecondary institution, delineated here as “alternative, IHE-based.” As with traditional preparation programs, these IHEs can be public, nonprofit, or for profit. Alternative, IHE-based programs will sometimes provide a master’s degree for program completion. Alternative programs can also be run by another type of nonprofit or for-profit organization, delineated here as “alternative, non-IHE.” Requirements such as length of time, coursework, and training for these programs can vary widely based on state laws for teacher licensure and the program’s design.33
Overall numbers for each state, displayed in Figure 4, mask significant differences in enrollment trends among different types of programs. Though there were large variations by state, traditional teacher preparation programs experienced declining enrollment overall. However, the patterns for other types of programs were much more variable. Over the time period of the analysis—2010 to 2018—enrollment in traditional teacher preparation programs across the United States declined by 43 percent, but enrollment in non-IHE alternative certification programs saw a 42 percent increase. Alternative certification programs in IHEs saw their enrollment decline by 19 percent over the same time period. While many states do not have any programs in either of the alternative program categories, Figure 6 shows that there was high growth in these categories in a number of states that have them.
Because Figure 6 displays the percentage change in enrollment in three types of teacher preparation programs, some information is lost for states that had no enrollment in either type of alternative preparation program in 2010 but had some students enrolled in such programs by 2018. States that saw growth in enrollment in IHE-based alternative programs from zero include Delaware (zero to 213), Minnesota (zero to 1,215), Nevada (zero to 723), New Jersey (zero to 1,575), North Carolina (zero to 1,633), North Dakota (zero to 24), and Vermont (zero to 152). States that saw growth in enrollment in non-IHE alternative programs from zero include Arizona (zero to 28), the District of Columbia (zero to 486), Indiana (zero to 11), Michigan (zero to 10), Nevada (zero to 870), Rhode Island (zero to 50), and West Virginia (zero to 40).
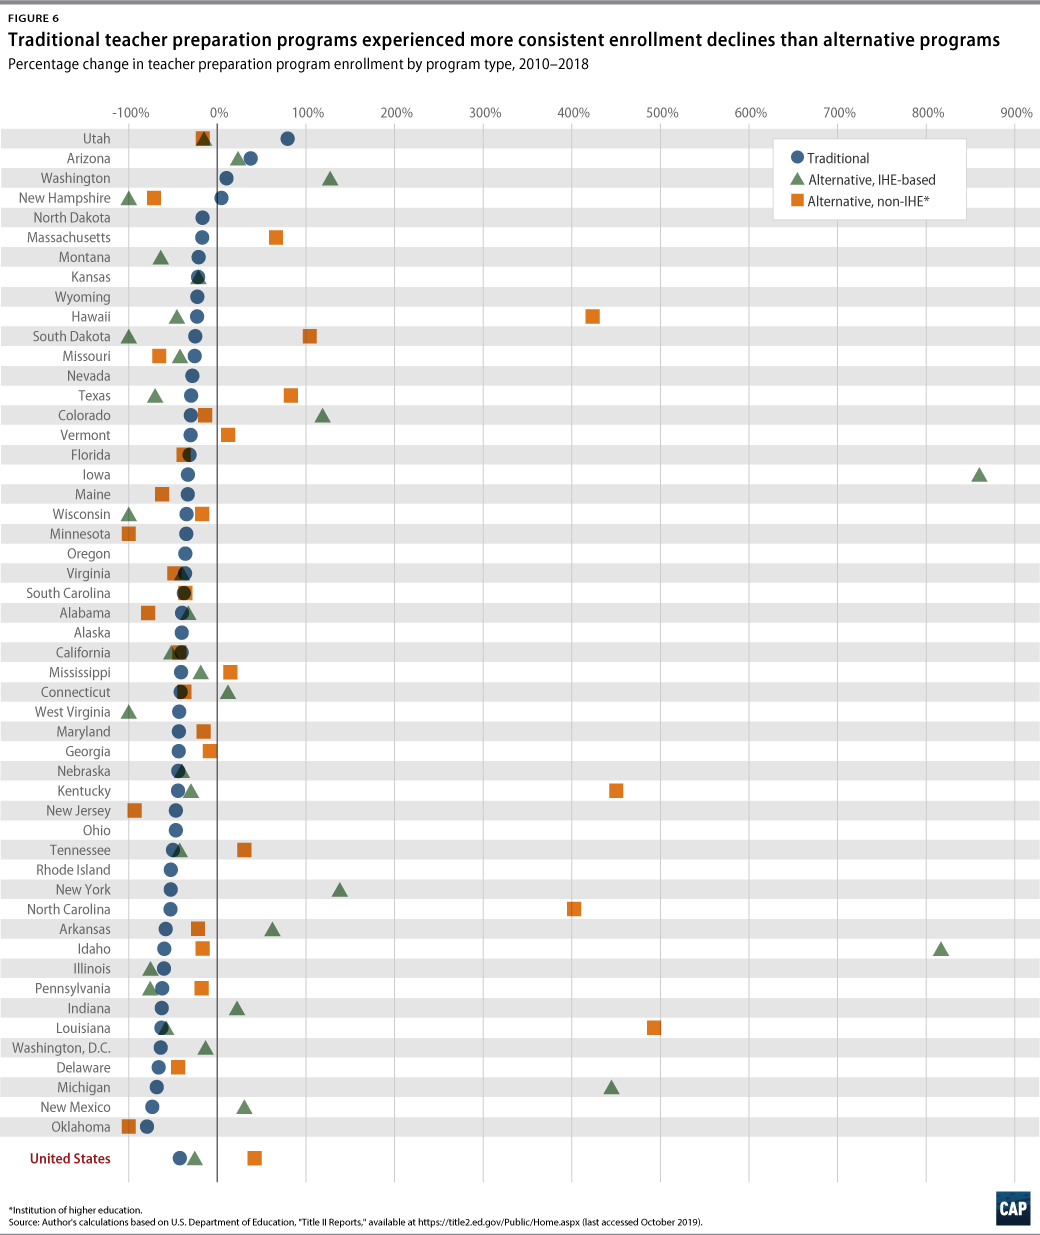
Notably, Texas enrolls more candidates in non-IHE alternative certification teacher preparation programs than any other state in the nation. Enrollment in this sector in Texas grew by almost 30,000 students from 2010 to 2018, which is roughly the same as the increase in this sector nationally over the same time period. This indicates that the substantial growth seen in Texas drove the growth in this sector overall. Some of the implications and caveats relevant to Texas’ specific enrollment data are discussed in further detail in the next section.
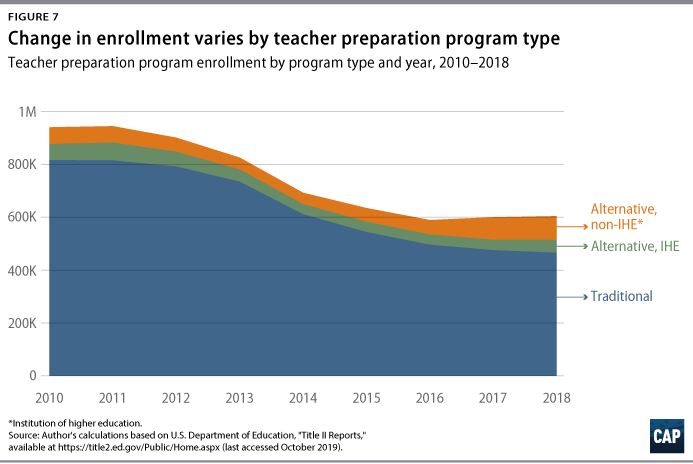
The national numbers for each type of teacher preparation program, shown in Figure 7, make clear that the decline in enrollment in traditional teacher preparation programs is more drastic than the overall numbers would imply. In particular, the slight uptick in overall enrollment in 2016 and 2017 of approximately 15,000 students was driven by increasing enrollment in alternative certification programs, especially of the non-IHE variety.
Traditional teacher preparation programs are experiencing the most consistent decline in completers of all program types
The only states in which the number of completers of traditional teacher preparation programs increased from 2010 to 2018 were Utah, by 15 percent; North Dakota, by 14 percent; Massachusetts, by 5 percent; and Virginia, by 1 percent. Maine, Delaware, Illinois, Michigan, and New Mexico all experienced declines of more than 50 percent.
The changes in the number of students completing alternative certification programs varied more widely by state. Many states do not have alternative certification programs or only have one of the two types. This is in part because alternative preparation is a much smaller sector than traditional preparation, which means that opening a new program or two can result in a significant difference in the number of teachers who complete preparation this way. For example, the more than 600 percent increase in non-IHE alternative certification enrollment in Tennessee represents a change from 15 completers to 110 completers—still comprising a small portion of the state’s 2,904 total number of completers. By far, the state with the most completers in the non-IHE alternative certification sector is Texas, which had 12,243 of the nation’s 19,158 completers in this sector.
As with enrollment numbers, some information on completers in these three types of preparation programs is lost for states that had no completers in either type of alternative preparation program in 2010 but had some students completing such programs by 2018. (see Figure 8) States that saw an increase in completers in IHE-based alternative programs from zero included Delaware (zero to 67), Idaho (zero to 17), Minnesota (zero to 447), Nevada (zero to 212), New Jersey (zero to 1,022), North Carolina (zero to 508), and Vermont (zero to 59). States that saw growth in completers in non-IHE alternative certification programs from zero included Arizona (zero to 14), Delaware (zero to 13), the District of Columbia (zero to 191), Hawaii (zero to 103), Michigan (zero to 10), Nevada (zero to 36), Rhode Island (zero to 25), and West Virginia (zero to eight).
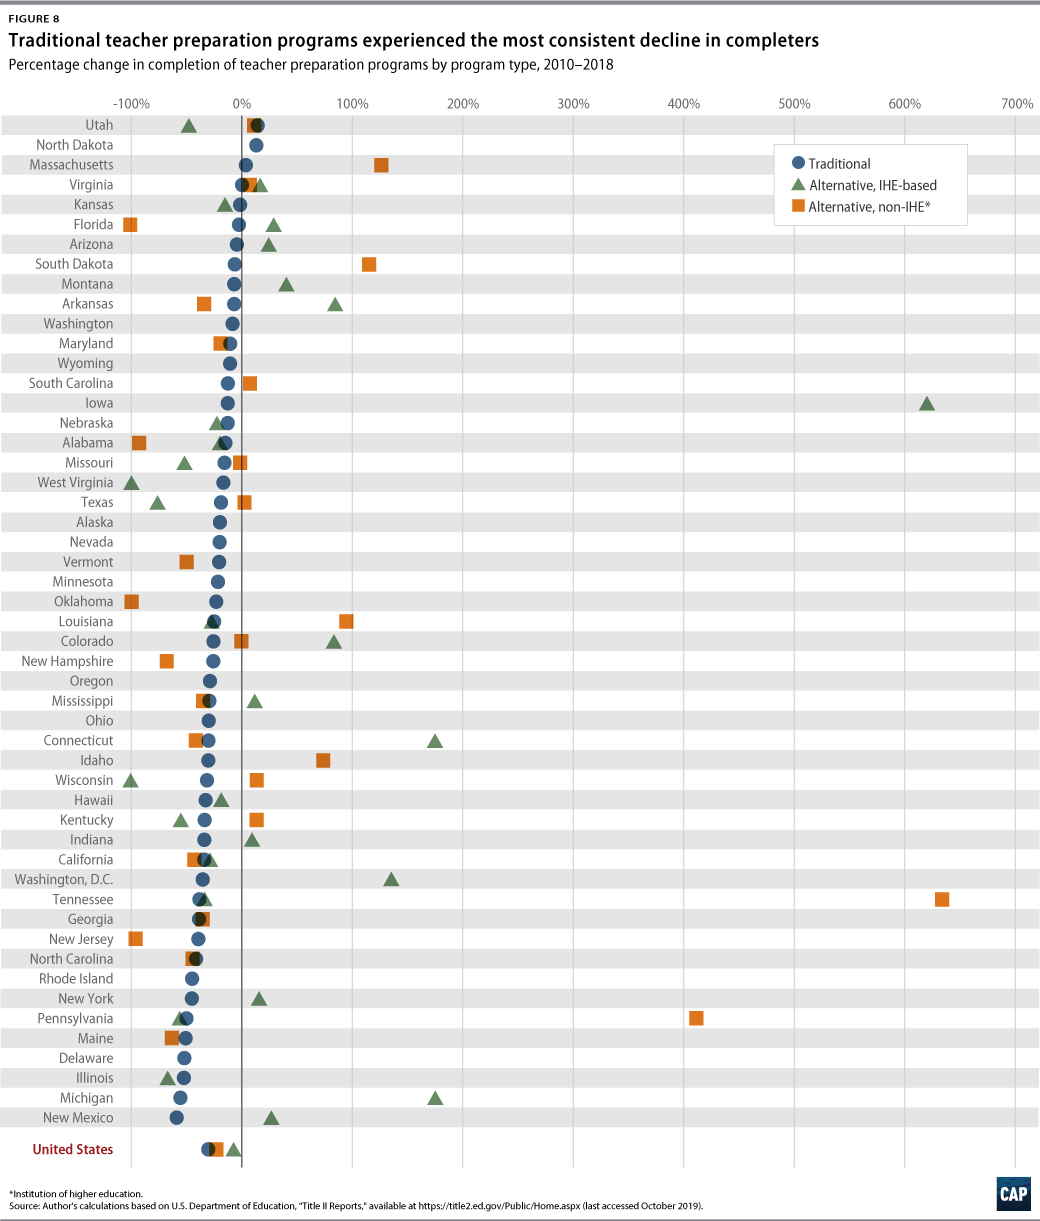
Because Figure 8 displays the percentage change in completers from 2010 to 2018 for each program type, it allows for comparison with changes in enrollment over the same time period. As shown in Figure 9, data for completers go back to 2001; however, prior to the 2010 reporting year, information on alternative certification completers was not broken down into the IHE-based and non-IHE categories.
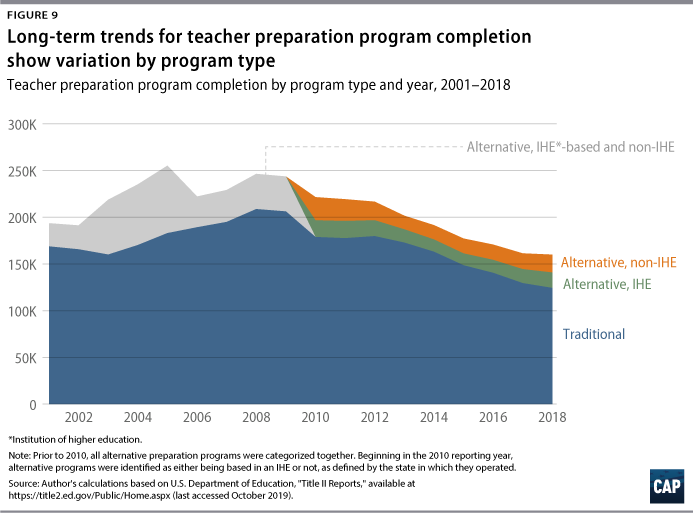
One thing that becomes clear with the additional data is that the number of completers graduating from the alternative certification sector was much larger in the past; from 2001 to 2018, the number of completers peaked in 2005 with slightly more than 72,000 graduates. Figure 9 also displays how the number of people completing preparation programs in this sector has sometimes varied widely, such as when it decreased abruptly from 72,000 in 2005 to about 33,000 in 2006. Completion of traditional teacher preparation programs peaked in 2008 with almost 209,000 graduates but has been slowly declining ever since, dipping below the previous 2003 nadir in 2015 and continuing to fall thereafter.
Decline in enrollment varies by race and ethnicity and raises concerns for teacher diversity in several states
Changes in enrollment in teacher preparation programs by race and ethnicity are especially important to examine due to the need for greater teacher diversity. Figure 10 details national numbers broken down by the race and ethnicity categories provided as part of states’ HEA Title II reporting.
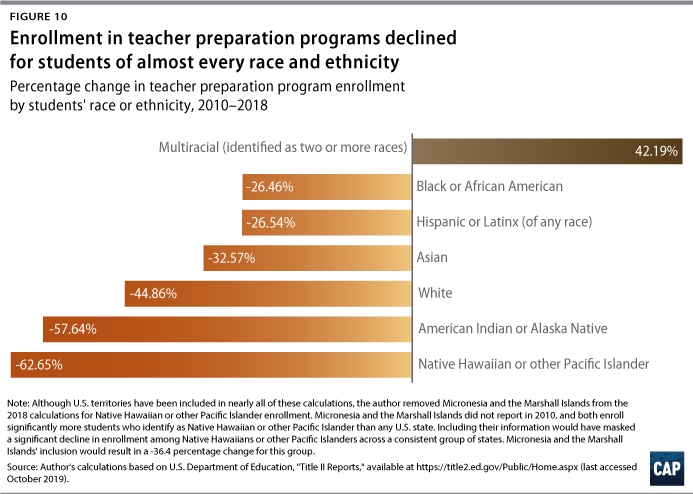
Nationally, the steepest percentage decline in enrollment was among teacher candidates who identified as Native Hawaiians or Pacific Islanders, followed closely by those who identified as American Indian or Alaska Native. Though the declines for both of these groups represent a relatively small absolute number and a small portion of the national decline, they are particularly concerning, because research shows that Native American and Native Hawaiian students benefit from culturally relevant pedagogy,34 and Native American and Native Hawaiian teachers can be uniquely situated to provide such an experience to their students.
The next steepest decline in enrollment was for teacher candidates who identified as white, meaning that the decline was less pronounced for teacher candidates who identified as other races and ethnicities, including Asian, Black or African American, and Hispanic or Latinx. However, it is particularly troubling that one-quarter fewer Black and Latinx candidates are enrolling in teacher preparation since more students from these racially and ethnically underrepresented groups are enrolling in higher education than ever before35—and as discussed in the introduction, there are already too few Black and Latinx teachers. Moreover, students who are Black and Latinx comprise the largest proportion of students of color in U.S. schools,36 and the schools these students attend are more likely to have high levels of poverty,37 receive less funding,38 and be racially isolated.39 Indeed, these are some of the reasons that most of the research about the importance of teacher diversity has focused on teachers who are Black and Latinx. While it would be more alarming if the decline in Black and Latinx candidates was steeper than the one-third decline in enrollment in teacher preparation programs for all students, the current numbers are still concerning.
Like teachers who identify as Black or Latinx, teachers who identify as Asian are enrolling in teacher preparation in much lower numbers compared with their enrollment in 2010. Not only do Asians comprise only 2 percent of the teaching profession,40 but Asians are the fastest growing racial or ethnic group in the country.41 This means that there will be a growing gap between the percentage of the teacher workforce who identifies as Asian and the percentage of students who identify as Asian.
Unfortunately, the data for completers are not disaggregated by race and ethnicity, so the author was unable to analyze changes in completers compared with changes in the enrollment figures displayed in Figure 10.
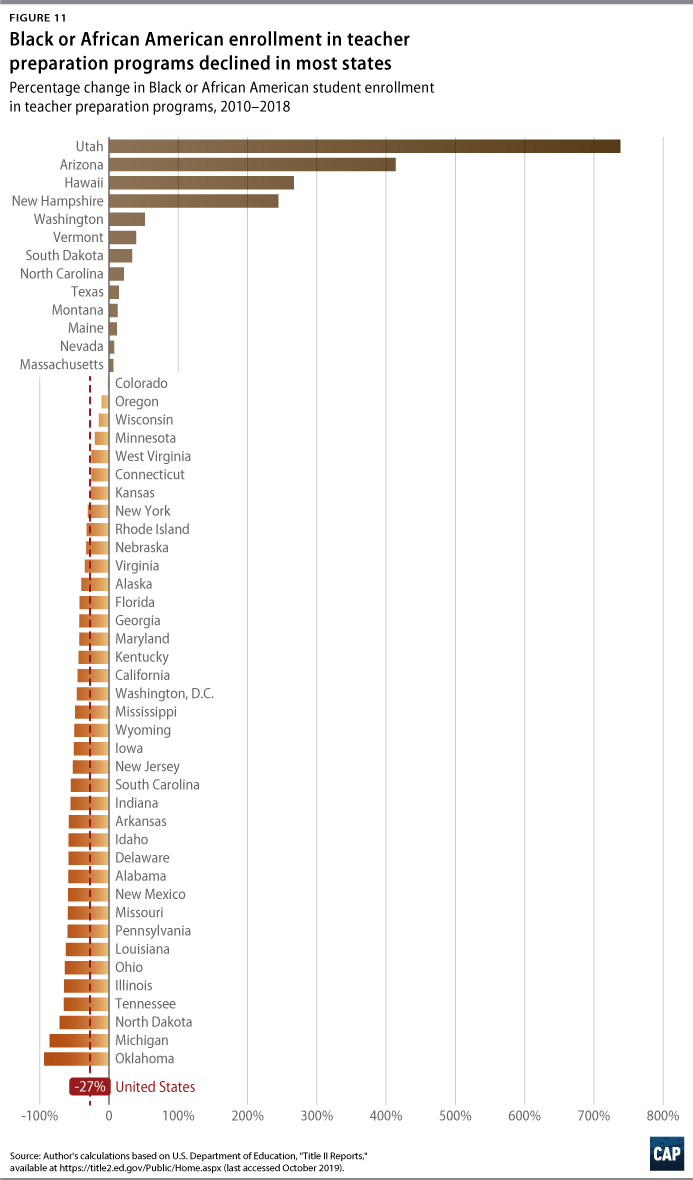
The author was able to analyze the change in enrollment in teacher preparation programs in individual states for teachers who identified as Black or Latinx. Figure 11 shows the percentage change in Black teacher candidates from 2010 to 2018 for each state. Though most states had a decline in enrollment of Black teacher candidates, 13 states saw an increase in enrollment: Utah, Arizona, Hawaii, New Hampshire, Washington, Vermont, South Dakota, North Carolina, Texas, Montana, Maine, Nevada, and Massachusetts. While the percentage increases for states such as Utah, Hawaii, and New Hampshire look very large, these states only had a combined total enrollment of less than 250 students who identified as Black. Arizona had the largest absolute increase in enrollment of Black teacher candidates with an increase of more than 6,000 students from 2010 to 2018.
Overall, 14,757 fewer Black students from across the country enrolled in teacher preparation programs in 2018 than in 2010. Oklahoma alone saw a drop of more than 2,000 enrollees, representing the largest decline in absolute numbers.
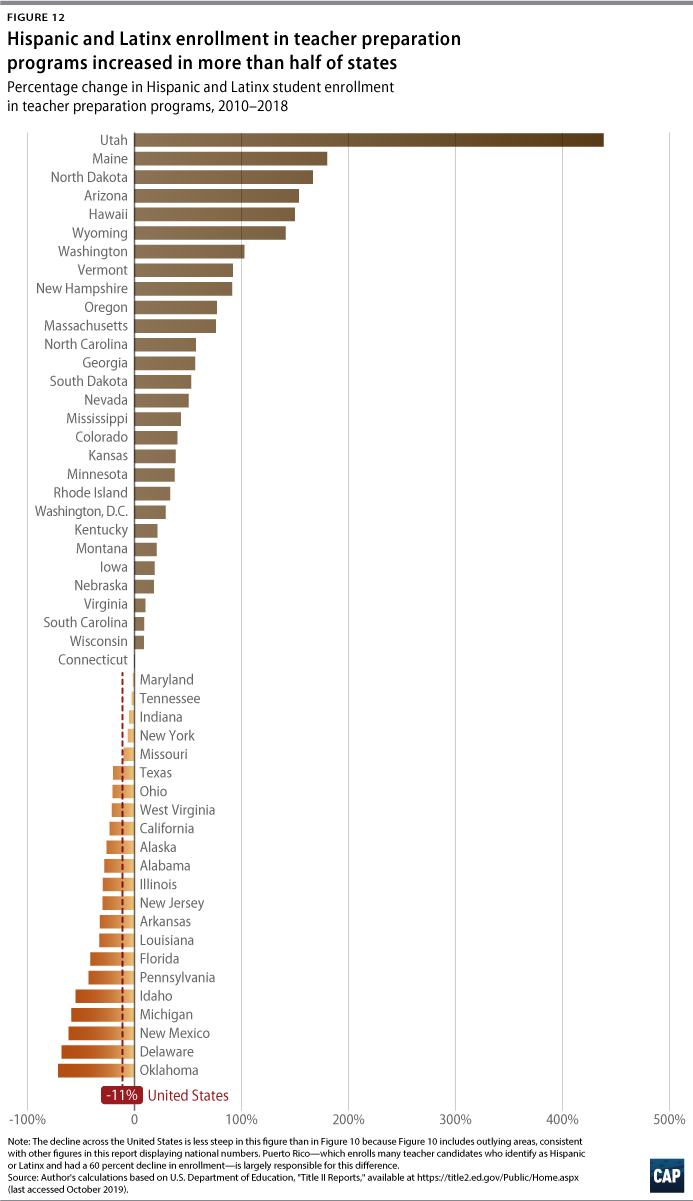
As with enrollment of teacher candidates who identify as Black, the change in enrollment of students who identify as Hispanic or Latinx varied by state, with many states posting a decline in enrollment. (see Figure 12) The states with the largest declines by absolute numbers were Texas, with 3,867; California, with 2,053; New Mexico, with 1,346; and Florida, with 1,238. Twenty-eight states and the District of Columbia saw an increase in enrollment of Hispanic or Latinx teacher candidates from 2010 to 2018, although in 17 states, this change represented 30 or fewer students. The only state in which there was an increase of more than 1,000 students who identified as Hispanic or Latinx was Arizona, with an enrollment increase of 3,071.
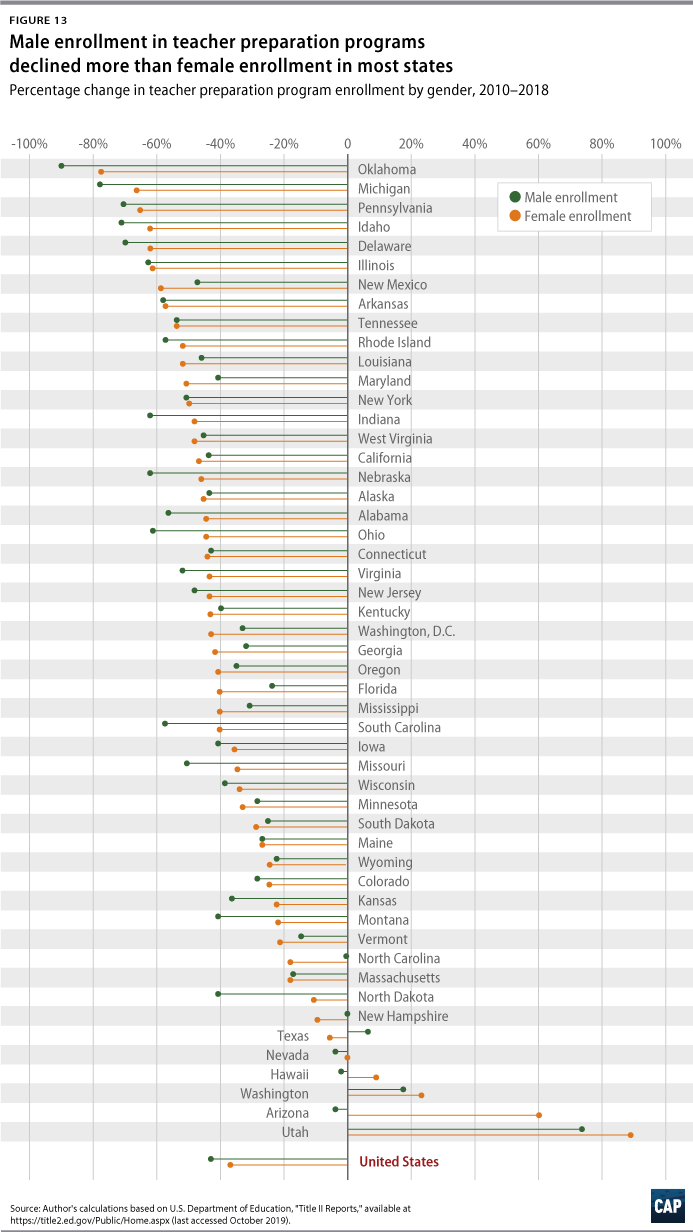
Most states saw a greater decline in enrollment of men
In most states, the decline in enrollment in teacher preparation programs was steeper for men. Nationally, the difference was not huge—a 38 percent decline for women and a 44 percent decline for men. However, because the teaching profession is already 77 percent female,42 it is concerning that the field may become even more skewed. The state with the steepest decline in both male and female enrollment was Oklahoma, at 91 percent and 79 percent respectively. The declines in male and female enrollment were only a few percentage points apart in most states. However, Arizona was a notable exception with a 5 percent decline in male enrollment but a 61 percent increase in female enrollment. (see Figure 13)
Change in the number of students completing teacher preparation programs in high-needs fields and subjects varies
Because there are persistent teacher shortages in particular fields and subject areas, such as English-language learners, STEM fields, and special education,43 the author examined data on the numbers of completers in these fields and how they have changed over time. Data on enrollment were not available by subject, and the data on completers only went back to 2012.
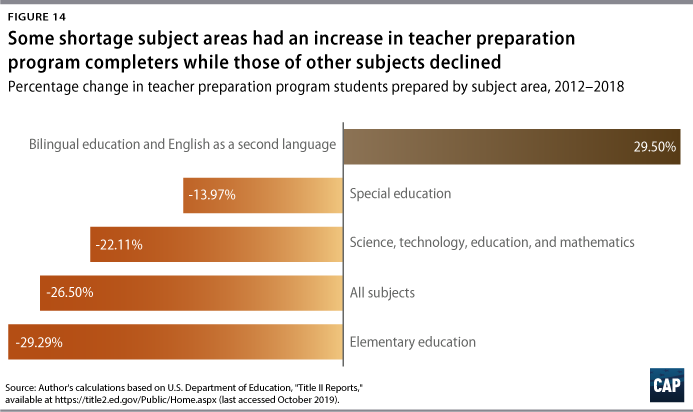
Overall, the number of students completing preparation programs declined by 27 percent from 2012 to 2018. There was a steeper decline of 29 percent for students completing preparation for elementary education during this time period. Historically, researchers found that more graduates than needed were obtaining this degree,44 so the steeper decline could be interpreted as a potential right-sizing of completers in this subject area. However, as discussed later in this report, the exact cause is hard to determine without access to better data.
There are persistent teacher shortages in science, technology, education, and mathematics fields.45 Research posits that this is because teachers with these credentials or students majoring in these subjects are more likely to have higher-paying options in other employment sectors.46 The author created a “STEM teachers index” that included candidates preparing to teach in biology, chemistry, computer science, earth science, mathematics, physics, and general science and found a 22 percent decline in the number of people completing preparation programs in these fields. (see Figure 14)
There are also persistent shortages of special education teachers and teachers of English-language learners. As shown in Figure 14, the decline in students completing preparation to become special education teachers from 2012 to 2018 was relatively modest, at 14 percent. One positive finding in this analysis is that there was a 30 percent increase in teachers preparing to teach English as a second language (ESL) or bilingual education, indicating a greater interest in this in-demand field. This increase is particularly heartening, because schools have long struggled to find enough bilingual teachers to meet their needs, and many states have consistently reported shortages of ESL teachers.47
The next section examines teacher preparation policies in Texas and California, two of the largest states in the nation and two of the states that prepare the most teachers. While similar in this respect, California and Texas are addressing teacher preparation in markedly different ways.
State profiles: Texas and California
Texas
Texas prepares a large number of the nation’s teachers and is one of only a few states bucking the national trend of declining enrollment. In fact, Texas had the highest enrollment in teacher preparation programs of any state in 2018 at 96,914, an increase of 9 percent since 2010.
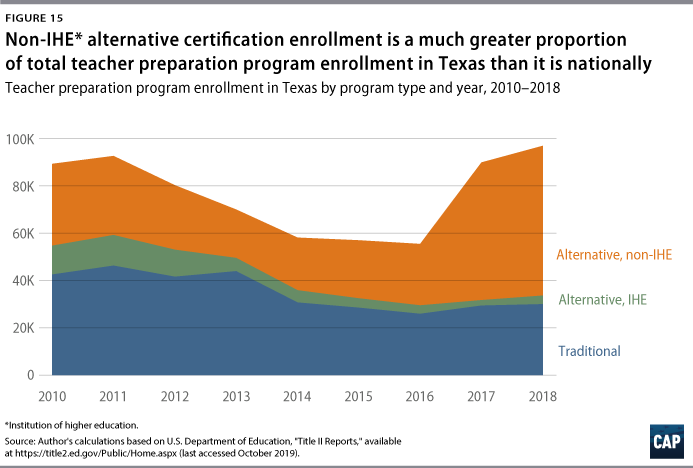
As Figure 15 shows, traditional teacher preparation programs in Texas have experienced a decline in enrollment of about one-third, which is relatively similar to the national downward trend. However, Texas’ proportion of total enrollment made up by the non-IHE alternative certification sector is unique. Figure 7 shows that at the national level, non-IHE alternative certification programs comprise only a small sliver of total enrollment. In Texas, these programs have an enrollment of more than 60,000 students, representing about two-thirds of enrollment in teacher preparation programs across the state. Additionally, the number of non-IHE alternative certification programs in Texas appears to have grown quite rapidly since 2016.
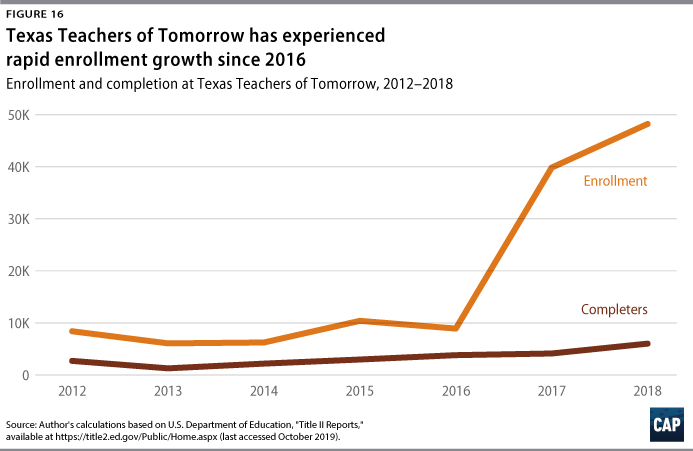
The author examined enrollment in Texas’ non-IHE alternative certification programs in more detail, finding that although most of the state’s non-IHE alternative certification programs are relatively small, the program that enrolls the most students—Texas Teachers of Tomorrow—is very large. This program reports enrollment of 48,218 students, a number that eclipses not only the next largest non-IHE program in Texas, which has only 2,241 students, but also the next largest teacher preparation program of any type in the country: Grand Canyon University in Arizona, which has a total enrollment of 25,524.48
Texas Teachers of Tomorrow is also growing rapidly. In 2012, the first year for which institution-level data are available, its total enrollment was 8,398. As enrollment has more than quintupled since 2017, the organization has undergone a rebranding effort. Formerly known as A+ Texas Teachers, the organization renamed itself Texas Teachers of Tomorrow in 2016 and began expanding into other states.49
It is important to note that the rapid growth of Texas Teachers of Tomorrow is in enrollment, not completion, and this growth has only occurred in the past few years. When looking only at completers data, which are available for individual institutions starting from 2012, the increases are much smaller. In 2012, Texas Teacher of Tomorrow reported 2,709 students completing a teacher preparation program compared with 6,022 in 2018. (see Figure 16) This means that while the number of completers more than doubled, the number of enrollees in the program grew fivefold. To understand why these trends diverge, it is helpful to know more about this program’s model, which is significantly different from that of many other teacher preparation programs.
Like most other alternative certification programs, Texas Teachers of Tomorrow is designed for students who are seeking to become teachers but already have a bachelor’s degree. Typically, these programs require some level of training before a teacher enters the classroom and then provide ongoing training and coursework during the program, in which an enrollee may be the teacher heading their own classroom, a resident teacher working in the classroom of a mentor teacher, or something similar. To enroll in Teachers of Tomorrow, however, a prospective teacher pays $295 upfront and owes the program between $2,70050 and $5,40051 from their first year of paychecks as a teacher, with the amount varying by state. This program cost does not include any certification costs for tests and background checks. Students also do not qualify for federal loans because the program is not approved by a federally recognized accreditor; it is, however, approved by the Troops to Teachers program, allowing veterans to qualify for financial assistance.52
These costs unlock access to a postgraduate alternative certification program with self-paced coursework that is entirely online. There is no syllabus, and the modules consist of videos and PowerPoint slides that students click through themselves. The only other requirement is 480 hours of a teaching internship: Students can immediately enter the classroom and teach on their own before undergoing any formal observation, taking coursework, or gaining supervised teaching experience.53 Texas Teachers of Tomorrow also facilitates hiring events and job fairs for students seeking teaching positions.54
One study of Texas teacher preparation programs was unable to find significant differences in student learning outcomes among teachers from different preparation programs,55 including Texas Teachers of Tomorrow. However, research on the higher education sector more broadly has shown that primarily online for-profit programs are associated with poor outcomes for students, including a reduced likelihood of obtaining employment compared with students who attend public institutions.56
Texas Teachers of Tomorrow’s model has faced backlash and criticism from teachers unions57 and other teacher certification programs.58 Current and former students have also written critical evaluations of the program, referencing material that is “outdated, idealized, or otherwise completely inapplicable.”59 Student reviewers also bring up problems attempting to contact the organization, citing phone calls and emails left unanswered indefinitely.60
Although official graduation data are not available because Texas Teachers of Tomorrow is a for-profit company that is not affiliated with a traditional IHE, current enrollment numbers far outpace numbers for completion, likely due to this model.61 Because the bar for entry into the program is relatively low—it is very inexpensive compared with the cost of enrolling in a master’s degree program—it is likely that there are many students who enroll but do not ultimately complete the program.
This last point matters, because, for this type of program, enrollment information in the Title II data are cumulative: Students who enrolled several years ago but never got a teaching job or finished the required online modules would still be counted as enrolled, and these students would add up year after year. A student in a similar situation at a traditional preparation program would no longer count as enrolled, as they likely would have formally withdrawn from the program. It is also worth noting that there is an inconsistency with Texas Teachers of Tomorrow’s data in that the enrollment of male and female students only sums to about two-thirds of the program’s reported total enrollment. Administrators for the HEA Title II database told the author that they had also noticed this discrepancy, but both the Texas Education Agency and Texas Teachers of Tomorrow certified that the data were correct as reported.62 This discrepancy is another possible explanation for the program’s high enrollment numbers.
While this model is unusual for a teacher preparation program, the company that runs Texas Teachers of Tomorrow, Teachers of Tomorrow LLC, is actively working to spread it to more states. According to Chief Development Officer David Saba, Teachers of Tomorrow worked to pass legislation in South Carolina, North Carolina, and Michigan around teacher certification and testing,63 presumably to make both processes friendlier to its alternative certification model. Since starting in Texas, Teachers of Tomorrow has expanded to Arizona, Florida, Indiana, Michigan, Nevada, North Carolina, and South Carolina—and according to its website, is planning to expand into more states soon.64 Across all affiliates, Teachers of Tomorrow reports that it has certified more than 45,000 teachers in total.65 Given the existing research in the higher education sector on for-profit institutions that are primarily online,66 this company’s rapid growth may be reason for concern.
California
As is true for most states, enrollment in California’s teacher preparation programs is declining. The state is also experiencing widespread teacher shortages67 and has had a number of teacher strikes this year that point to growing unrest with teacher pay, working conditions, and historic underinvestment in education by the state.68
However, California is moving in the opposite direction of states such as Texas that have opened up pathways for for-profit, all-online alternative certification programs. California has only 13 non-IHE alternative certification programs, all of which are run by school districts, charter management organizations, or county offices of education,69 in contrast with nearly 50 such programs in Texas. Many of the non-IHE programs in Texas are similar in structure to those in California, but unlike in the latter state, some of Texas’ largest programs—including Texas Teachers of Tomorrow; iteachTEXAS; Teachworthy; and etools4Education, which is listed in the Title II database as a “Web-Centric Alternative Certification Program”—are online programs that are for profit or part of a for-profit company.70
In an effort to address the teacher shortage without depending on this type of alternative certification, California has worked to improve entry into the profession. The state invested $75 million into a teacher residency program in 201871 and recently announced that awards would be given to programs to prepare more special education, STEM, and/or bilingual teachers in the state.72
In order to transition from a preliminary teaching license to a long-term license in California, teachers need to complete a state-approved induction program.73 Induction programs are designed to ease entry into the profession by providing novice teachers with mentoring and coaching, job-embedded feedback, and other services. High-quality induction programs are associated with increased teacher retention and additional months of learning for students.74 California has also sought to improve retention in high-needs schools by awarding $20,000 stipends to teachers in low-performing schools who earn National Board Certification.75
Linda Darling-Hammond, president of California’s Board of Education, has also proposed policies that would reduce the cost of training to become a teacher, such as restoring scholarships for teacher preparation programs or offering student loan forgiveness to credentialed teachers who enter high-needs schools.76
To recruit prospective teachers into high-needs subjects, California universities are partnering with STEM organizations and nonprofits to entice young math and science teachers.77 In a similar effort, the California Department of Education developed a website that lets interested participants create personalized career plans, read about inspirational teachers in the state, and learn about what scholarships and financial aid are available.78
States across the country are grappling with declining enrollment in teacher preparation programs and uncertainty about how best to prepare teachers. California and Texas offer two alternative visions for how to address this issue. Texas has welcomed many models of alternative certification programs, some of which are for profit and all online. In contrast, California has focused on improving teacher training and retention and has proposed reducing the costs associated with preparing to teach, aiming to alleviate teacher shortages without changing the type of preparation teachers receive before entering the classroom.
Understanding the relationship between enrollment in preparation programs and teacher labor markets
A decline in teacher preparation program enrollment may be problematic for K-12 schools and students if it leads to a shortage of well-prepared, highly skilled, and racially diverse teachers in classrooms. But knowing there is a decline in enrollment provides only partial information; policymakers also need to consider other aspects of the teacher labor market such as vacancies, hiring needs, and teacher turnover rates.
Researchers have spent a significant amount of time thinking about how many teachers leave the profession and why. For many years, an estimate that about half of all new teachers leave within five years was widely cited79 and used as the basis for specific policy recommendations to improve teacher retention and quality.80 Later, longitudinal data demonstrated that the rate at which teachers leave is actually much lower.81 However, the reports of shortages in many states in 2015 and 201682 as well as the teacher strikes and protests that took place in 2018 and 201983 indicate that there is unrest and dissatisfaction within the profession, particularly in states with low teacher salaries.
Beyond the rate at which teachers leave the profession, there is still much to learn about how supply and demand interact in teacher labor markets. While some researchers have created thorough projections of supply and demand of teachers nationally and concluded that a shortage is looming,84 other experts have disputed this prediction.85 The proportion of teachers who are not fully certified is another indicator that researchers have used to argue that a national shortage is large and growing. According to the Economic Policy Institute, 1 in 10 teachers in high-poverty schools are not fully certified.86 Furthermore, nearly 10 percent of schools reported that they were trying but unable to fill a vacancy in the 2015-16 academic year, up from 3.1 percent of schools reporting such difficulty in 2011-12. The findings were relatively similar for high- and low-poverty schools.87
Aside from the potential that too few total students are completing teacher preparation programs to fill every classroom, there are other possible explanations for reports of persistent vacancies. One is that a portion of students who complete teacher preparation programs may not intend to teach or may decide after getting their degree that it is not the career for them. The data show that this may be true for a small but significant portion of education majors. In a national survey, 69 percent of those who majored in education taught as a regular, full-time teacher in the five years after graduation, and an additional 16 percent taught in some other form, such as a substitute or teacher’s aide. This leaves 16 percent of education majors who never taught in the five years after graduating with an education degree.88 However, some researchers have assumed that most students who prepare to teach plan to do so and concluded that only about half of preparation program graduates are able to find a full-time teaching position as a result of a continuing oversupply of teacher candidates.89
Another potential reason for persistent reported vacancies is a mismatch between the type of education degrees earned and the fields and subjects in which teacher vacancies are common. Supporting this hypothesis is the fact that since 1998, states have noted lasting shortages in fields such as special education, math, and science in their annual reporting to the U.S. Department of Education.90 However, because states only report the subject areas in which they are experiencing shortages and do not provide information about the number of vacancies or the overall demand for teachers in these subject areas, it remains difficult to meaningfully quantify the extent of these shortages and the degree to which more teacher preparation program completers are needed in these fields.
Finally, vacancies may persist because teacher salaries are currently too low to meet demand. Teachers continue to experience a wage penalty of 13 percent91 compared with other college-educated professionals. This gap tends to be especially significant for midcareer teachers, who tend to have a flatter salary trajectory than their college-educated peers in other career fields and who are not yet nearing retirement age when more generous pension benefits may factor into their compensation.92 Research has demonstrated that the teacher labor market is responsive to changes in pay just like other occupations. Changes in pay can affect not only teacher attrition, but also the pool of candidates choosing to enroll in teacher preparation programs.93 For this reason, during an economic downturn, enrollment in teacher preparation programs tends to decline.94 Following the Great Recession, one study found that enrollment in teacher preparation programs declined more steeply in states that had experienced widespread layoffs, a correlation which supports the hypothesis that teacher pay, broader economic trends, and interest in the teaching profession are interrelated.95
Regardless of whether there may be a current or coming national teacher shortage, a more sophisticated analysis of national information is probably a fool’s errand. The national supply and demand of teachers is mostly irrelevant information, amounting to an averaging of many local markets that vary widely. In fits and starts, states have begun to collect teacher supply and demand information, and research organizations and think tanks have begun to compile these data in order to gain a national picture of the landscape of local labor markets. While providing some useful information on more local labor markets, these compilations mostly highlight the need for more and better data collection and analysis on local and state teacher supply and demand.
For example, the Learning Policy Institute sought out information on vacancies in every state but was only able to publish reported vacancies from eight states.96 The National Council on Teacher Quality examined states’ data collection practices on teacher shortages and surpluses across all 50 states, finding that while 29 states collect teacher supply data from teacher preparation programs, only eight make connections between teacher demand and the supply data collected.97 The American Institutes for Research also explored different ways states can calculate or estimate teacher supply and demand; it analyzed data published by seven states, noting that the “reports vary in comprehensiveness and rigor.”98
While the HEA Title II data used for this report provide significant information related to states’ supply of newly prepared teachers, no consistent data exist on state-by-state teacher demand. Even statewide information would in some ways be insufficient, as many states include both a large metropolitan area and areas that are more rural or remote, which face very different staffing challenges.
Policy recommendations
This analysis provides insight into trends in the teacher preparation sector and highlights the need for more data collection and further investigation to ensure that policy proposals are targeted to the areas of greatest need. Many states are demonstrating a steep overall decline in enrollment, so even if a state has previously overproduced teachers relative to need, such large declines may merit further consideration. Likewise, the decline in enrollment of certain groups of students or the decline in degrees obtained in high-needs fields have important policy implications. The Center for American Progress recommends the following steps to continue to advance the understanding of the decline in teacher preparation program enrollment and teacher labor markets.
Gather and report more data on teacher preparation programs and teacher labor markets
Many key questions remain about the policy implications of the decline in enrollment and completion of teacher preparation programs. There are several ways to improve data collection so that policymakers have better data to inform their decisions. Additional data may also help researchers and policymakers better understand why it is difficult to differentiate programs by quality and whether the availability of additional information would make such differentiation possible.
For HEA Title II reporting, the recommendations below would improve researchers’ and federal policymakers’ understanding of the national teacher preparation landscape:
- Through HEA Title II reporting, the federal government should disaggregate data for both enrollees and completers by race, ethnicity, and gender. In July 2019, the U.S. Department of Education proposed this change, and the Center for American Progress submitted comments in support of adding this information to the current data collection process.99 As discussed in the technical appendix of this report, enrollees and completers are mutually exclusive categories in this data collection; because only enrollment numbers are disaggregated, important information about the race, ethnicity, and gender of graduates of teacher preparation programs is unavailable. Having this information would provide policymakers with information about whether there are disparities between the population of students who enroll in teacher preparation and the number of enrollees who complete their programs.
- Through HEA Title II reporting, the federal government should collect cohort graduation rates of teacher preparation programs. HEA Title II reporting currently asks for programs to report the number of enrollees and completers, but because of the varying lengths of teacher preparation programs, this is not enough information to calculate accurate graduation rates for programs—i.e., the percentage of enrollees who complete in the expected time. Graduation rates are an important marker of quality and are required reporting for high schools100 and institutions of higher education;101 the same should be true for teacher preparation programs. As with other data reported for HEA Title II, cohort graduation rates should be disaggregated in order to determine if there are disparities in graduation outcomes by race, ethnicity, or gender.
- Through HEA Title II reporting, the federal government should collect information on whether programs are for profit and whether they are primarily online, defined consistently with other higher education data reporting. Teacher preparation programs are currently categorized as traditional or alternative certification; the latter category is further divided into programs that reside in IHEs and non-IHE programs. Without information on which programs and how many are for profit or primarily online, there is no way to determine whether these programs have different outcomes from their nonprofit and brick-and-mortar counterparts. These details have particular relevance for policymakers, because research has shown that for-profit higher education tends to be more expensive than public institutions102 and produces poor outcomes for students.103 For-profit colleges also tend to market themselves to women and people of color, compounding existing inequities in educational outcomes and debt.104
Outside of HEA Title II reporting, other data collection would provide important information to policymakers seeking to better understand teacher labor markets:
- The federal government should expand data collection on additional indicators of teacher supply and demand. In addition to changes in HEA Title II reporting, national reporting on other information relevant to the supply and demand of teachers, such as the number of new teachers hired and the number of vacancies, would expand researchers’ and policymakers’ understanding of the extent of teacher shortages. Some of this information was previously collected in the Schools and Staffing Survey and its offshoot, the Beginning Teacher Longitudinal Study, as well as the National Teacher and Principal Survey, the findings of which informed this report.105 However, the sample sizes of currently administered surveys do not allow for disaggregation of data by state.
- States should collect and report information on their teacher supply and demand with support from the federal government. In the absence of better national data, state policymakers should publish thorough reports on their teacher supply and demand to better understand local teacher labor markets, determine whether they are meeting demand, and project future needs and shortages. States can also use this information to determine whether they are meeting goals such as increasing the number of teachers from diverse racial and ethnic backgrounds. Such a report would go beyond information on how many teacher preparation program graduates a state produces or how many vacancies there are to providing a more nuanced analysis of the data. This would allow state policymakers to predict shortages in certain subjects and locations for the coming years and respond accordingly in advance rather than responding after the fact—something that narrows the policy options available to less desirable choices such as the expansion of emergency certifications.
While collecting and reporting more complete information on teacher supply and demand may incur an upfront cost, it could potentially lead to more cost-effective policymaking. States have many ways to influence the supply and demand of their teachers, including teacher preparation program approval; laws and regulations related to alternative certification; licensure and certification policies; statewide salary schedules or other state support for teacher salaries; and state-based financial incentives for teachers such as scholarships or loan forgiveness. Having better information can allow policymakers to develop more targeted policy solutions using these levers, if appropriate. For example, policymakers could create a program specifically designed to increase the number of special education teachers in a state. As with previous shifts in how states collect and analyze education data, federal support for states to perform these types of analyses could encourage participation.
Approach the for-profit non-IHE alternative certification sector with appropriate skepticism
Much like the for-profit education sector did during the 2000s, some for-profit teacher preparation programs, such as Texas Teachers of Tomorrow, are expanding aggressively.106 However, unlike for-profit colleges that are affiliated with IHEs, non-IHE alternative certification programs that are for profit are not subject to many of the regulations and reporting requirements that apply to IHEs.
While the author does not advocate for eliminating the non-IHE alternative certification sector altogether—many high-quality programs with positive outcomes, such as the Boston Teacher Residency,107 are part of this sector—increased regulation and transparency, particularly of for-profit actors, is warranted. To ensure that all teacher preparation programs, including non-IHE alternative certification programs, are providing quality preparation for teacher candidates:
- States should resist opening the floodgates to new, for-profit, non-IHE alternative certification programs. In states that do not already have a non-IHE alternative certification sector that includes for-profit actors, state policymakers should be wary of advocates who seek new, more lax pathways to certification on the pretext that the state has a teacher shortage. As discussed in the previous section, very few states have data on their teacher supply and demand, so it is best to determine first if there is an actual shortage before changing policy. Furthermore, many of these for-profit, non-IHE alternative certification programs have a business model similar to that of other for-profit colleges—a model that has tended to lead to worse outcomes for students.
Use improved data collection to develop targeted solutions to improve teacher preparation and modernize and elevate the teaching profession
The substantial decline in enrollment in teacher preparation programs nationally—as well as the more severe declines that become visible once the data are broken down by state, race and ethnicity, and subject—do not happen in a vacuum. Declining interest in the teaching profession may be related to a fundamental mismatch: The work is challenging and complex, but the pay, training, and prestige do not reflect this. College-educated professionals have other career options that provide them with better working conditions and pay and responsibilities that increase over the course of their career as they become more skilled in their chosen field. These differences are even more marked for students majoring in STEM fields or for students under more financial pressure, such as low-income students, first-generation college students, or students with a higher debt burden.
With improved data collection efforts described in the sections above, policymakers could implement targeted solutions to modernize and elevate the teaching profession to increase interest. For example, they could provide scholarships to students of color or first-generation college students who commit to teach in a STEM field, or they could offer a higher salary schedule for preparation program graduates who have completed a year of high-quality clinical training in a high-needs school and agree to teach in the same community.
Conclusion
While enrollment in teacher preparation programs nationally has declined by more than one-third since 2010, the analysis described in this report paints a more complex and nuanced picture than the national number portrays. The analysis found significant variation among states in the change in enrollment in teacher preparation programs. While the author found that declining enrollment and completion are not necessarily more drastic among underrepresented racial and ethnic groups, such as Black and Latinx teachers, or in fields and subjects that have persistent teacher shortages, the extent of the overall trend is still concerning. A deeper dive into two states—Texas and California—reveals divergent state policies and regulations for how to address teacher shortages and exemplifies a worrying trend in the rapid growth of for-profit, non-IHE alternative certification programs. Policymakers should consider greater state and federal regulation of this sector, along with additional data collection, to help better understand not only the decline in enrollment in teacher preparation programs but also the characteristics of U.S. teacher labor markets more broadly.
About the author
Lisette Partelow is the senior director of K-12 Strategic Initiatives at the Center for American Progress. Her previous experience includes teaching first grade in Washington, D.C., working as a senior legislative assistant for Rep. Dave Loebsack (D-IA), and working as a legislative associate at the Alliance for Excellent Education. She has also worked at the U.S. House of Representatives Committee on Education and Labor and the American Institutes for Research. Partelow has a master’s degree in public affairs from Princeton University and a master’s degree in elementary education from George Mason University. She received a B.A. from Connecticut College.
Acknowledgments
Thank you to several members of the staff at the Center for American Progress who reviewed drafts, provided research assistance, created preliminary data analysis, conducted data quality checks, and helped write the state profiles in this report: Antoinette Flores, Ashley Jeffrey, Abby Quirk, and Jessica Yin. Thank you also to the reviewers who provided invaluable feedback on a draft of this report: Chad Aldeman, Roxanne Garza, Paige Kowalski, Carrie Murthy, Hannah Putman, Elizabeth Ross, Melissa Tooley, Justin Trinidad, and Amy Wooten.
Technical appendix
The author had two conversations in March 2019 and September 2019 with staff at the Title II Support Center, a contract managed by Westat, about how to correctly use these data. The Support Center informed the author that enrollee data and completer data were mutually exclusive categories. In other words, anyone who was enrolled in a teacher preparation program in a given academic year and completed the program in that same year was counted in the completers category but not the enrollees category. Therefore, most of the enrollment figures in this report add the numbers for enrollees and completers together. However, the data for completers were not disaggregated by gender or race and ethnicity, so figures 10 through 13 include enrollees only.
The years displayed in this report are consistent with those reported on the HEA Title II Reports site. For example, 2018 information was reported in 2018 but reflects data from the 2016-17 academic year, which is the same way the data are presented by the U.S. Department of Education.
For all of the figures that include state-by-state numbers, outlying areas such as American Samoa, the Marshall Islands, Micronesia, Puerto Rico, the Northern Mariana Islands, and the U.S. Virgin Islands were excluded. Some of these outlying areas do not appear in all years of the data. With most of the information displayed as a percentage change, including the small number of enrollees in these outlying locations led to extreme data outliers. However, relevant information on outlying areas is available upon request from the author. When only national numbers are displayed, such as in figures 1 through 3 and Figure 7, data from outlying areas are included in the national totals.