Introduction and summary
“[T]he lack of affordable housing stands in the way of economic productivity and undermines the fundamental premise that full-time workers should be able to achieve a decent standard of living for themselves and their families.” – Bruce Katz and Margery Austin Turner, 20081
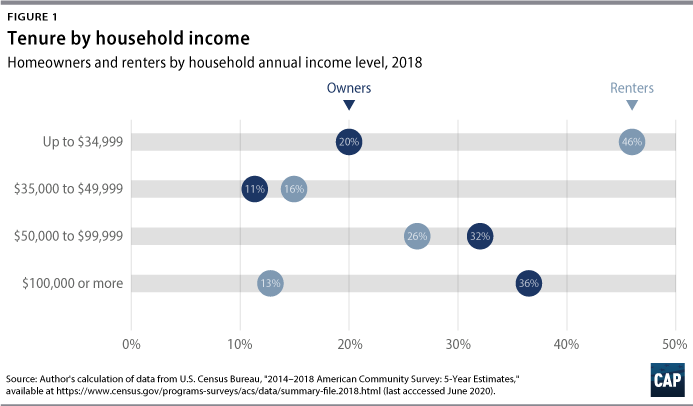
Rising income inequality, combined with high housing costs, and a shortage of affordable rental housing across the nation and particularly in large metropolitan regions, has been creating a significant financial burden for growing numbers of working families, especially those of low-income workers.2 And the COVID-19 pandemic and related shutdowns and layoffs have exacerbated this problem. Lower-wage workers in particular are the most likely to have incurred a loss of income due to the pandemic.3 And as a disproportionate segment of low-income households rent their homes (see Figure 1), many are facing housing insecurity and evictions, as they lack the financial resources to compensate for missed paychecks and as moratoria on evictions and foreclosures are set to expire soon.4 Most importantly, these same families were already struggling before the onset of the pandemic due to a severe shortage of affordable housing throughout the nation.5 In the face of what most likely will be double-digit unemployment lasting through 2021,6 creating jobs by expanding affordable housing would be a smart long-term investment.
The lack of affordable housing is a matter of public policy because overspending on housing reduces the financial resources available to families for purchasing health care, investing in their children’s futures, saving for retirement, and addressing the severe hardships associated with a pandemic, other natural disasters, and sudden economic downturns such as the current one.
The U.S. Census Bureau’s data indicate that income inequality is at its highest level in more than five decades, even though the nation was experiencing its longest economic expansion before the pandemic.7 Despite some recent economic gains by low-income workers, incomes have continued to rise more slowly for workers at the bottom brackets of the wage spectrum than for those employed in high-skill, high-wage jobs.8 In 2017, 46 percent of renter households spent more than 30 percent of their income to meet housing costs. As Figure 1 shows, being a renter is more common among low-income households than among those with higher incomes. The rental affordability problem is exacerbated by the shortage of affordable rental housing, as the supply of low-cost housing has dropped and new construction has been intended largely for the higher end of the market. The Joint Center for Housing Studies at Harvard University indicates that between 2011 and 2017, the number of housing units renting for less than $600 a month fell by 3.1 million.9 This report finds that affordable rental units are in short supply, especially in areas that were experiencing job growth before the pandemic.
While it is important to ensure that renters, especially those in the lower brackets of the income distribution, remain in their homes during the pandemic, it is equally critical for the nation to be prepared for an eventual economic recovery.10 The shortage of affordable housing undermines not only a swift economic recovery but also the economic competitiveness and productivity of metropolitan areas, as high housing costs affect regional economies’ ability to attract new firms and businesses and to expand existing ones. Most importantly, the mere addition of new jobs to metropolitan areas once their economies recover cannot ensure that all residents have equal access to economic opportunities unless there is a sufficient supply of affordable units to house the local workforce. In fact, in many cities, workers often live far from available job opportunities. The distance from jobs affects both employees and employers. As workers move farther from their workplace in search for affordable housing, long commutes affect the quality of life of families, reduce productivity, and contribute to employee turnover, especially among low- and moderate-wage workers.11 Rising rents in strong markets threaten the ability of local businesses to attract and retain workers,12 and employers cannot fill open positions.13 A recent National Bureau of Economic Research working paper14 has found that because of the cost of housing in job-rich areas, the migration patterns of low-income households have started to diverge from those of high-income households. Many low-wage workers have been moving away from or have not been moving to places where they could earn higher wages. Aggregated across the nation, the lack of worker migration to higher-wage jobs in growing metropolitan regions due to a lack of affordable housing lowers total economic output.
To ensure that all workers benefit from an eventual economic recovery and economic growth, it is important to understand and address the jobs-housing challenges that low-wage workers face and advance policies that promote better access to affordable housing in conjunction with greater proximity and connectivity to job opportunities. People employed in low-wage jobs spend a greater portion of their income on housing and transportation than those employed in high-wage jobs, and they are more constrained in their ability to commute long distances. Ensuring that the local housing supply fits locally employed low-wage workers’ ability to afford it would address social equity, as it would lead to shorter commutes, a better quality of life, and a boost in disposable income and savings opportunities. In addition, it would address regional inequity by responding to the fiscal imbalances across jurisdictional boundaries. These imbalances are created by the gap between the substantial sales tax revenues generated by low-wage, job-rich retail and restaurant industries in some localities, and the fiscal drain experienced by jurisdictions providing the largest share of affordable housing in a region, which generally produces less tax revenue. And finally, ensuring a good jobs-housing fit by increasing the supply of affordable housing would create much-needed jobs, especially during the post-pandemic economic recovery.
This report examines the jobs-housing fit for low-wage workers in 15 large U.S. metropolitan areas that experienced above-average job growth from the Great Recession up until the current pandemic. After discussing prevalent trends in the geographic distribution of jobs and housing, the report explores the notion of the jobs-housing fit and describes the distribution of this measure across the selected sample of metropolitan areas. There is no agreed-upon definition of low-wage workers in the literature and policy discussions.15 For statistical purposes and because of the data limitations discussed below, the analysis presented in this report adopts low educational attainment as a proxy of low-wage work.
The analysis indicates that in most metropolitan areas, a low-wage jobs-affordable housing fit that is poor characterizes many of the jurisdictions in which low-wage jobs are concentrated and where there is a shortage of affordable housing for low-wage workers employed in those jurisdictions. It is important to better connect low-wage workers with their workplaces by strategically creating affordable housing near jobs and accessible transit options. In addition, addressing any poor jobs-housing fit ought to be a regional effort. In fact, in any given metropolitan area, there may be jurisdictions that perform better than others in terms of the jobs-housing fit. Usually, clusters of low-wage jobs cross individual jurisdictions’ boundaries. Furthermore, remote areas are often the only options available to low-income families but are not well connected to both central and suburban job-rich areas.
This report recommends a large-scale direct investment by the federal government in metropolitan land trusts (MLTs) on which equitable transit-oriented developments (eTODs) can be established, particularly in areas where the low-wage jobs-affordable housing fit is poor, in proximity to low-wage job hot spots, and where public transit connects the low-wage workforce to clusters of low-wage jobs. Specifically, this report recommends the following:
- Create a federal regulatory and funding mechanism that aligns new and existing transportation funding with affordable housing production for states that promote the establishment of MLTs in which eTODs can be developed.
- Create state mandates for inclusionary housing—that is to say, programs that tap the economic gains from rising real estate values to expand affordable rental and ownership opportunities for low- and moderate-income families.16
- Prioritize the development of rental housing by MLTs and allocate larger proportions of developed units to affordable housing.
- Ensure that local governments facilitate the acquisition of developable land by MLTs.
A persistent spatial mismatch for American low-wage workers
A persistent spatial mismatch—that is to say, where low-income workers live is not where suitable jobs are located—characterizes several U.S. metropolitan areas, particularly those that have experienced job growth in the wake of the Great Recession up until the current economic downturn caused by the COVID-19 outbreak. Low-wage workers, whose services are critical for the functioning of regional economies, may not always benefit from job growth and in particular from the spatial distribution of jobs, for at least a couple of reasons: (1) Because of the shortage of affordable housing near employment centers, these workers often reside in job-poor areas with an expensive and burdensome commute to employment opportunities, or (2) they may be forced to live in high-cost areas that they cannot afford in order to be close to their workplaces, with significant consequences for their quality of life, health care, children’s education, and savings opportunities.17
Much of the economic inequality and disadvantage experienced by low-income workers can be attributed to systemic patterns of economic development, investment, and socioeconomic exclusion at geographic levels that go beyond the individual neighborhood and encompass entire metropolitan regions and labor markets.18 The history of postwar urban growth in the United States clearly illustrates this point: Aided largely by public policies and programs that would create and perpetuate spatial inequalities, urban growth following World War II was characterized by the rapid suburbanization of jobs and infrastructure as middle-class white families fled central cities in search of less congestion, better services and amenities, racial homogeneity, and single-family homes. The suburbs also attracted manufacturing jobs and retail trade because of cheaper land and access to wealthier customers. As suburbs flourished, city-center neighborhoods, typically featuring a large population of color, were left behind and underwent a decadeslong cycle of disinvestment and poverty concentration.19 From 1970 to 2000, more than 100 central cities endured a net loss of population while suburbs continued to grow.20 Urban labor markets experienced substantial shifts, especially following the economic stagnation of the early 1970s and the subsequent economic restructuring. Employment in heavy manufacturing industries declined, and while manufacturing and other blue-collar industries relocated out of central cities, job growth tended to be concentrated in the sectors that are based on high and low technology and draw upon a mix of skilled and unskilled workers.21 At the same time, insufficient affordable housing in areas of job growth, exclusionary land policies,22 and discrimination in the housing market have continued to constrain the ability of low-wage workers to reside close to their workplaces.23
These patterns spurred significant interest among academics in what is known as spatial mismatch.24 First advanced by John Kain in 1968,25 the notion of spatial mismatch refers to the theory by which the suburbanization of jobs and the discriminatory barriers on the residential choice of city-center residents, especially Black residents, have produced a surplus of workers relative to the number of available jobs in city-center neighborhoods.26 This situation resulted in joblessness, lower wages, and longer commutes for city-center workers, especially in areas where the lack of adequate and reliable transportation amplified the distance between working families and employment opportunities.27
The location of employment and population has shifted further in more recent years.28 High-income suburban communities have begun experiencing some of the negative externalities created by rapid suburban growth and sprawl, such as long commutes, congestion, and environmental problems. These have spurred a return to the city in several parts of the United States and the end of white suburban flight.29 The back-to-the-city movement has accelerated greatly since 2000, when many individuals and families, predominantly affluent, young, educated, and white, began flowing back to urban centers attracted by transit access, walkability, services, and amenities. Highly visible reinvestment and rehabilitation by upper-class gentrifiers have boosted the centralization of headquarters and executive decision-making centers. Census data show that from 2007 to 2011, employment centers located in downtown areas in some of the largest metropolitan areas of the nation have experienced faster job growth than metropolitan peripheries, signaling not only the continuing shift of job growth toward high-wage knowledge and low-wage service jobs30 but also the resurgence of urban living and the increasing competitiveness of central cities compared with suburban locations in the wake of the Great Recession.31
Since the financial crash of 2008, major innovative companies and high-tech startups, which used to be concentrated in suburban office parks, have opted for more central city locations and the denser parts of metropolitan areas to attract and retain educated workers, be closer to their customers, and facilitate work relationships with other firms and institutions.32 Several companies in finance, software, and biotechnology, among others, have relocated or expanded their operations in downtown areas. Take, for example, Amazon, which established its headquarters in downtown Seattle, or Cirrus Logic, with its headquarters in the downtown district of Austin, Texas.33 Companies such as Twitter, Pinterest, and Yahoo have established their headquarters in downtown San Francisco, which, in recent years, has surpassed Silicon Valley as a hub for venture capital investment.34 Many companies have moved to central cities largely to tap the pool of high-skill and knowledge workers, whose presence in urban centers has significantly grown in recent years.35 At the same time, the growth of high-skill jobs in urban cores has led to the concomitant increase of service occupations that support the functioning of the business, finance, and innovation industries.36 According to economist Enrico Moretti, every new high-paying innovation job creates five new jobs in other industries, particularly for low-wage workers.37 These include food service workers, janitors, security guards, and cleaners, among others.38
As more affluent groups have moved to the urban core, lower-income families and large portions of the working class have been priced out of their neighborhoods—mainly a result of gentrification, rising housing prices and property values, and a growing shortage of affordable rental housing. The movement of low-income families to the suburbs has been prompted by the need to find affordable rental housing, which is available in older suburban neighborhoods characterized by aging homes vacated by middle-class families.39 The migration of low-income families and families of color out of city cores has resulted in the spreading of poverty out of the urban core and into the suburbs, where between 2000 and 2011, the number of people living in poverty grew by 64 percent.40 The suburbanization of poverty during the 2000s has also been linked to continued job decentralization.41 As businesses and factories in need of more space continued establishing and expanding their operations in suburban locations with lower land costs compared with downtown areas, opportunities in service occupations supporting these businesses have not always benefited the pool of low-wage workers living in the suburbs. The wages of such jobs have remained stagnant and have not kept up with the cost of suburban living. Most importantly, low-income households moving to the suburbs typically end up living in job-poor areas and in neighborhoods lacking public transit networks that could connect workers living in impoverished neighborhoods to good job opportunities located both in suburban areas and in urban cores.42 This is particularly clear in the Atlanta metropolitan area, where the transit system inefficiently connects low-wage suburban workers, especially those living in the southern part of the region, to suburban jobs mostly concentrated in the northern part of the area.43
A Brookings Institution study indicates that residents in high-poverty and majority-minority neighborhoods, many of which are in suburban areas, have experienced notable declines in job proximity.44 Proximity to job centers is particularly critical for certain groups, such as low-wage workers, as it can affect their job search, employment outcomes, and subsequent economic mobility opportunities. These individuals tend to face considerable spatial barriers to employment, as they are more constrained by the cost of housing and commuting compared with higher-income and higher-skilled workers, who can afford commuting by car and exercise greater residential choices.45
The remainder of this report focuses on the notion of the jobs-housing fit, which serves as a useful measure for understanding the housing needs of low-wage workers and for assessing if and how the local housing supply meets those needs in the 15 large U.S. metropolitan areas that have experienced above-average job growth in the wake of the Great Recession up until the current pandemic.
The jobs-housing fit
The notion of the jobs-housing fit refers to the extent to which locally available housing fits the ability of locally employed workers to afford it. The jobs-housing fit analytical approach was pioneered by professors Chris Benner and Alex Karner to evaluate how the housing supply in the San Francisco Bay Area meets the housing needs of households of different income levels.46 Benner and Karner’s study draws from an extensive academic literature that examines the issue of jobs-housing balance in U.S. urban and suburban areas. Much of that literature has been concerned with the importance of workers residing close to their workplaces in addressing transportation and environmental challenges, such as congestion, vehicle miles traveled, and greenhouse gas emissions.47 Some of the literature also draws attention to the relationship between jobs-housing balance and housing affordability, in that a shortage of and the high demand for affordable housing in proximity to jobs inevitably lead to the increase in housing prices.48 Work focusing on affordable housing has also raised the concern that exclusionary zoning49 has contributed to the creation of jobs-housing imbalances and the uneven geography of places with an adequate supply of affordable housing. These imbalances have particularly affected middle- and low-income workers for whom housing affordability is critical and often out of reach in job-rich suburban communities, where the production of affordable units and the development of high-density neighborhoods tend to be discouraged by local zoning regulations.50
Benner and Karner support the argument that while ensuring parity between the number of jobs and the amount of housing units matters in regional planning, it is not enough. Rather, a jobs-housing fit is more appropriate because, from an equity perspective, it is important to match the wage levels of local jobs and the affordability of local housing:51
Because high-income workers inherently have more flexibility and choice in terms of their housing location decisions, and because of the dynamics of suburban housing markets, this is a problem that manifests primarily in suburban locations that tend to underprovide affordable housing options for low-wage workers. The marginal value of a dollar saved is also likely to be higher for a low-wage worker. When provided with an opportunity to live closer to where they work, the reduction in transportation costs would be comparably much more attractive for a low-wage worker than a high-wage worker, all else equal.52
Low-income households, particularly households of color, are disadvantaged by a poor jobs-housing fit, as they are known to face several spatial barriers in their housing search, including discrimination in the housing market and exclusionary zoning practices that greatly limit their housing options, especially close to their workplaces.53 Compared with higher-wage workers, individuals employed in low-wage jobs typically spend a greater share of their income on housing- and transportation-related costs, are more constrained in their ability to travel long distances to work, and often drive older cars.
Benner and Karner operationalize the low-wage jobs-affordable housing fit as the ratio between the number of low-wage jobs and the number of rental units affordable to low-wage workers in a locality.54 The metric can spotlight areas in a region in which there is a need for affordable rental units to accommodate workers employed in local low-wage jobs. A key finding of the study is that cities in the Bay Area experiencing a growth in high-wage jobs are also experiencing a significant growth in low-wage jobs. However, these cities are not producing enough housing affordable to workers employed in low-wage jobs.
The analysis presented in this report adopts the framework developed by Benner and Karner and applies some modifications to the jobs-housing fit metric and the unit of analysis. (see detailed description below) Specifically, this report discusses the indicator measuring the distribution of low-wage jobs-affordable housing fit across the jurisdictions of the top 15 U.S. metropolitan areas that have experienced significant job gains since the Great Recession up until the current economic downturn spurred by COVID-19. As in Benner and Karner’s study, the jobs-housing fit computed in this analysis focuses on rental housing because low-income workers are generally more likely than high-income workers to rent their homes.55
The low-wage jobs-affordable housing fit metric
The low-wage jobs-affordable housing fit metric developed by Benner and Karner is based on calculations of publicly available data on jobs from the 2011 Longitudinal Employer-Household Dynamics Origin-Destination Employment Statistics (LODES) dataset and housing data from the American Community Survey’s (ACS) 2007–2011 five-year estimates. The LODES dataset, developed by the U.S. Census Bureau in conjunction with state partners, provides data on employment characteristics and commute flows based on employees’ workplace and residence at the census block level. The Bay Area study employs the number of jobs with monthly earnings of $1,250 or less as a measure of low-wage jobs. While the information on monthly earnings provided by the LODES dataset is important for identifying jobs at different wage levels, a critical shortcoming is associated with this variable, as the $1,250 monthly earning threshold for low-wage workers has never been adjusted for inflation and has been constant throughout the dataset series, which covers 16 years starting in 2002. In addition, when comparing different housing and labor markets characterized by varying costs of living, the variable needs some adjustments in the form of multipliers that would allow it to be contextualized to some extent. This limitation is particularly critical when combining information on low-wage jobs and data on housing affordability, as in the case of the jobs-housing fit metric for which it is necessary to establish what an affordable monthly rent would be for low-wage workers.56 Benner and Karner set the low-income threshold for an annual household income at $30,000, which is derived from multiplying the $1,250 monthly earnings by two, in part to account for households with two low-income earners and to facilitate consistent comparisons over time. Furthermore, the authors of the Bay Area study employ ACS data on rental units and specify an affordable monthly rent for low-wage earners of $750 per month based on the standard assumption that a household can afford its home if it spends no more than 30 percent of its annual income on housing costs.
The analysis presented in this report, which focuses on 15 metropolitan areas characterized by different costs of living, employs educational attainment as a proxy for low-wage labor. Specifically, the analysis focuses on workers with no more than a high school degree. The U.S. Census Bureau publishes median annual earnings by educational attainment for each metropolitan statistical area (MSA). In contrast with Benner and Karner’s methodological approach, this study employs median annual earnings for workers with a high school degree diploma or less to estimate the affordable monthly rent for low-wage workers in each of the metropolitan areas examined.
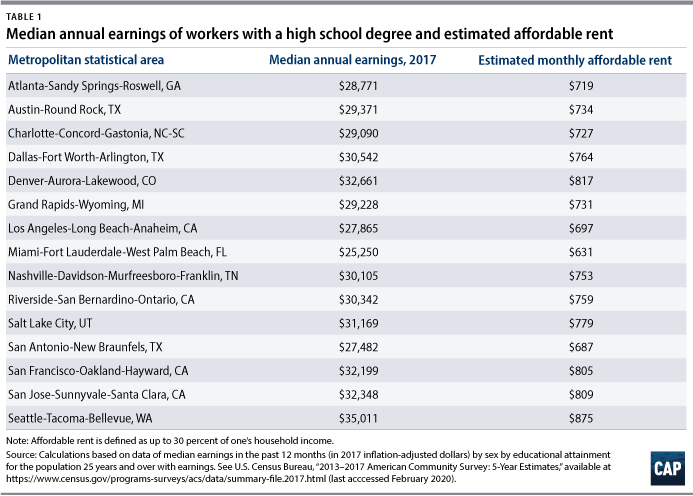
As in Benner and Karner’s study, the assumption is that a household can afford its rent if no more than 30 percent of its income is spent on housing costs. As illustrated in Table 1, the threshold income and affordable monthly rent vary across the sample of metropolitan areas. For the final calculation of the low-wage jobs-affordable housing fit, data on jobs come from the 2017 LODES dataset whereas data on affordable housing come from the ACS 2013–2017 five-year estimates. For every place in each of the selected metropolitan areas, the sum of low-wage jobs is divided by the sum of housing units57 with a rent no greater than the affordable monthly rent for the specific metropolitan area. A ratio greater than 2 indicates that a locality has more low-wage jobs than rental units affordable to low-wage workers, assuming two workers per household.
Low-wage jobs and affordable rental housing in 15 metropolitan areas
Table 2 illustrates some economic and housing characteristics of the selected metropolitan areas. From 2010 to 2017, these areas registered an average percentage increase in total nonfarm jobs of at least 20 percent, in the cases of Los Angeles and Seattle, and up to 32 percent, in Austin, Texas. The areas registering the highest rates of job growth feature a mix of high-skill knowledge-based and service-based economies.
With a few exceptions, the metropolitan areas in the sample feature a tight rental housing market, as their rental vacancy rates are typically much lower than the average U.S. rental vacancy rate (7.2 percent). In most cases, vacancy rates in these metropolitan areas have declined since 2010, indicating a growing demand of rental units.58 The San Jose, California, MSA, for example, experienced a drop in the rental vacancy rate from 10.3 percent in 2010 to 1.4 percent in 2017. The Riverside, California; Dallas; and Atlanta metropolitan areas have experienced similar significant drops.
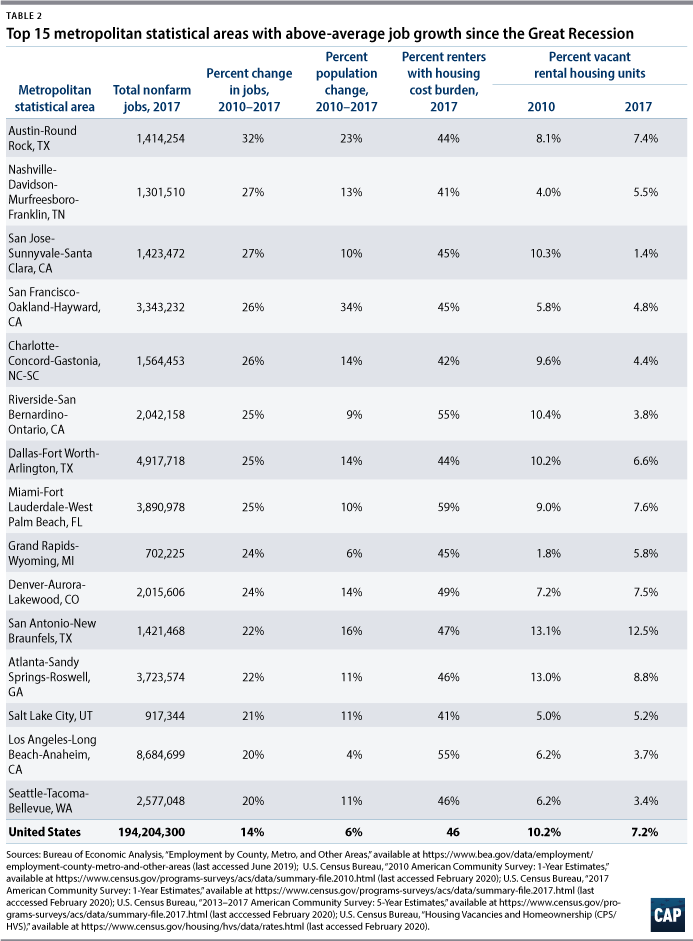
In all sample metropolitan areas, at least 43 percent of renters have experienced a housing cost burden—that is to say, they spend more than 30 percent of their income for housing costs. The share of cost-burdened renters is particularly large in coastal areas such as Riverside, Miami, and Los Angeles, where more than 50 percent of renter households sustain a rental affordability problem. The table in the Appendix of this report illustrates the housing cost burden for selected low-wage service occupations in the 15 metropolitan areas. Take for example, janitors: The median wage of janitors in these metropolitan areas is much lower than the annual income needed to afford a one-bedroom housing unit. In Los Angeles, the annual income needed to afford a one-bedroom unit is $51,360—1 1/2 times higher than a janitor’s median annual wage, $32,784, in the metropolitan area. With few exceptions, data for other service occupations show similar gaps. (see the table in the Appendix)
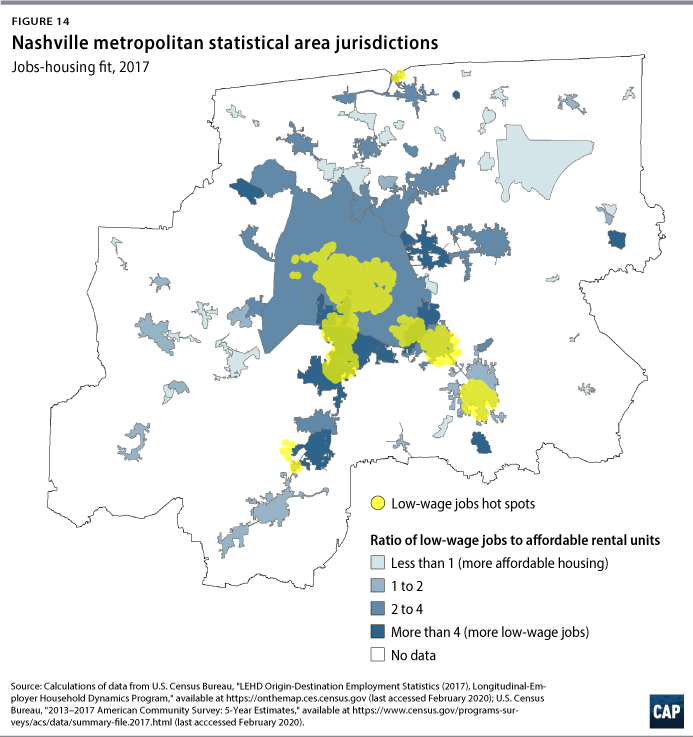
Commute flow data indicate that in most of the selected metropolitan areas, more than 50 percent of workers reside more than 10 miles from their workplaces. (see Table 3) In southern metropolitan areas such as Charlotte, North Carolina; Nashville, Tennessee; Dallas; and Atlanta, more than 60 percent of workers travel more than 10 miles to reach their workplaces. These data are consistent with the Brookings Institution’s finding that there is a growing distance between people and employment in metropolitan America.59
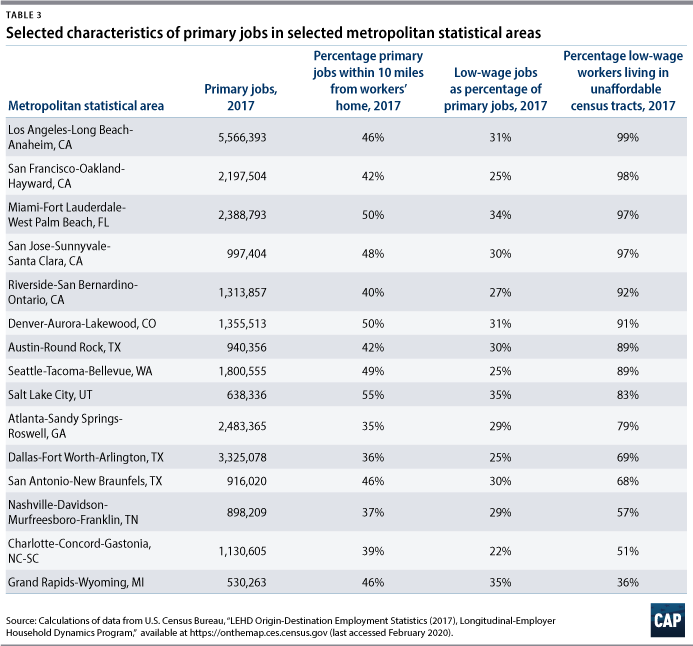
As discussed in the previous section of this report, proximity to jobs is particularly important for low-wage workers. Across the selected metropolitan areas, low-wage jobs represent between 22 percent, in Charlotte, and 35 percent, in Grand Rapids, Michigan, and Salt Lake City, of primary jobs. (see Table 3)60 These jobs are not evenly distributed throughout each metropolitan area. When their geographic distribution is compared with that of rental units affordable to low-wage workers, it is clear that in most areas, a low-wage jobs-affordable housing fit that is poor characterizes many of the jurisdictions in which low-wage jobs tend to be concentrated and where there is a shortage of affordable housing for low-wage workers employed in those jurisdictions.
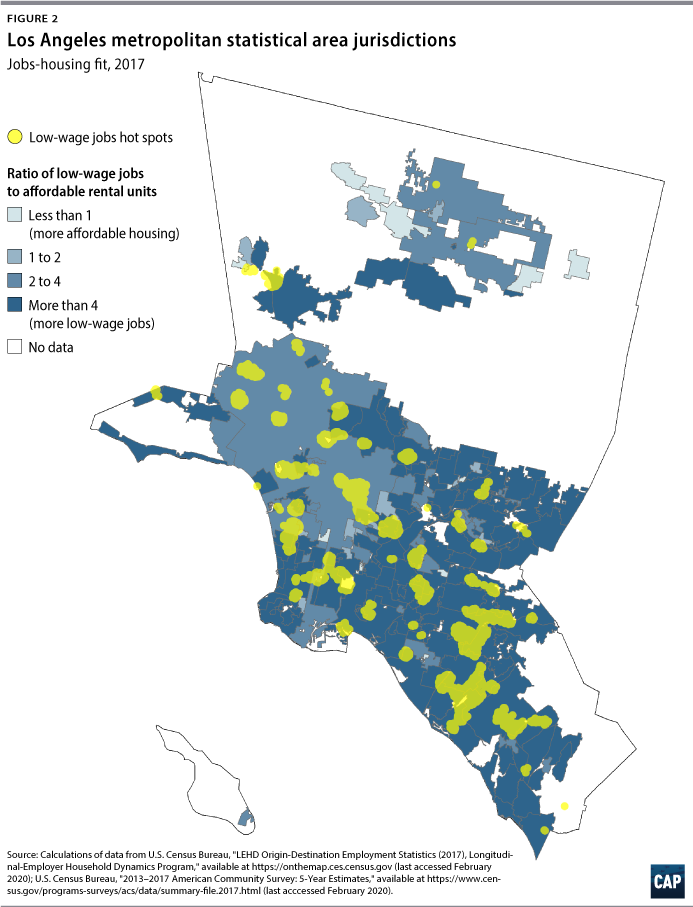
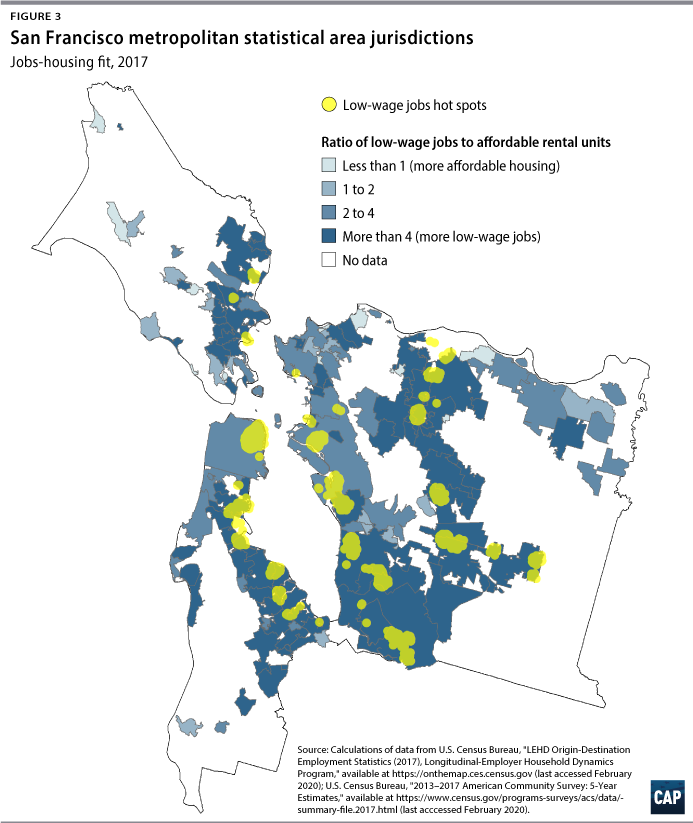
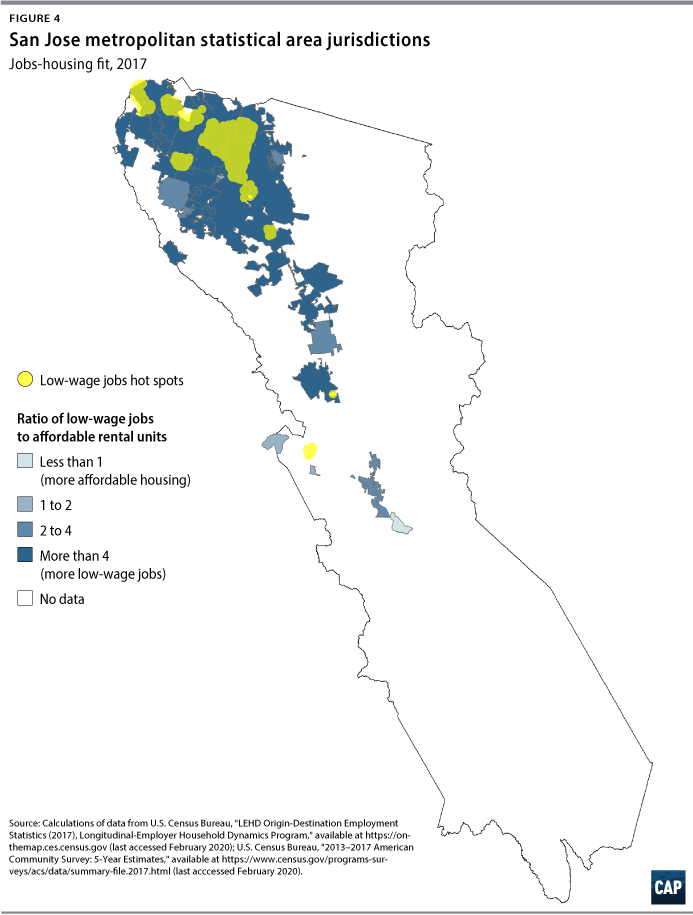
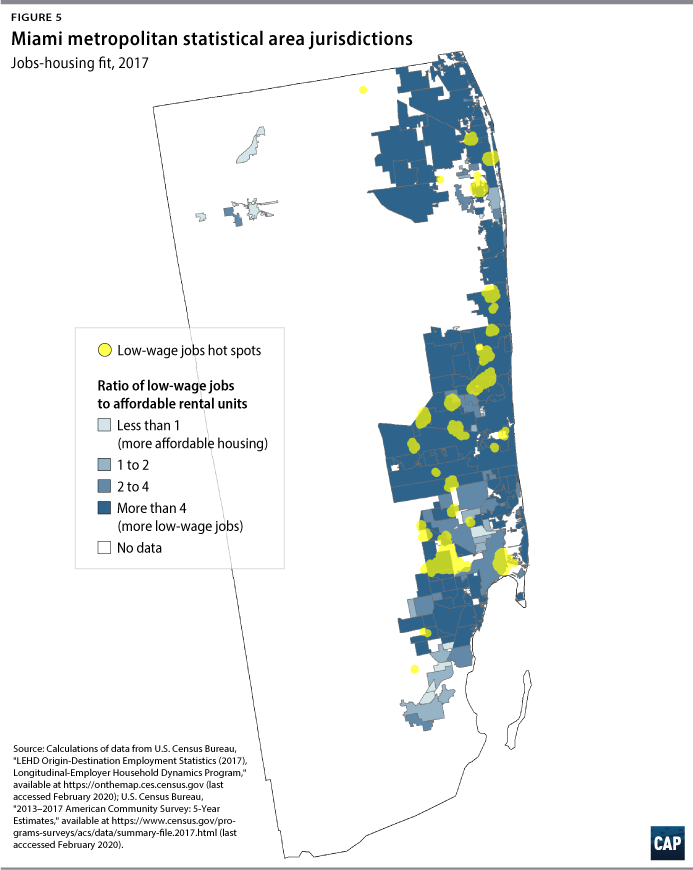
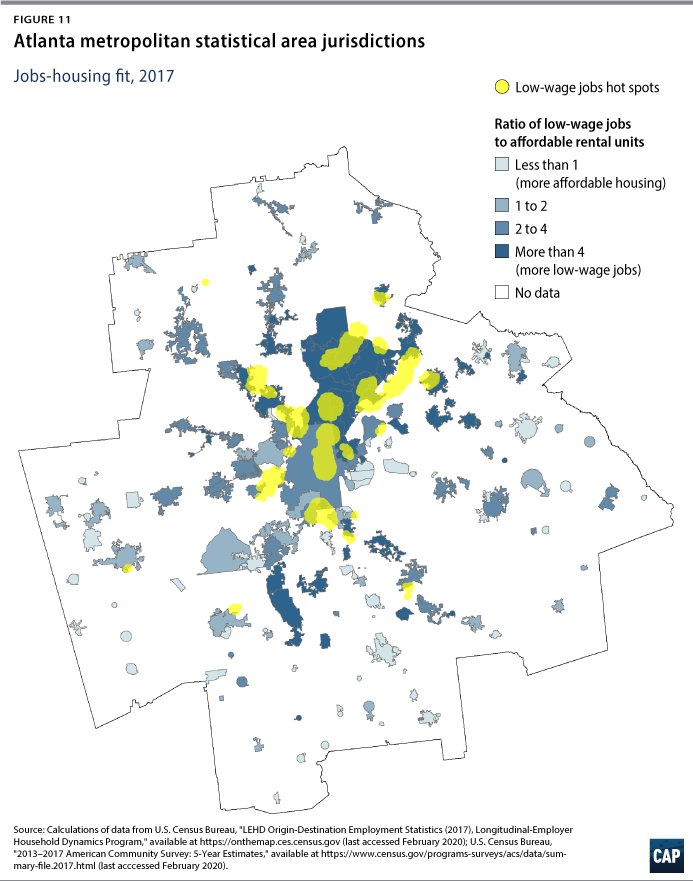
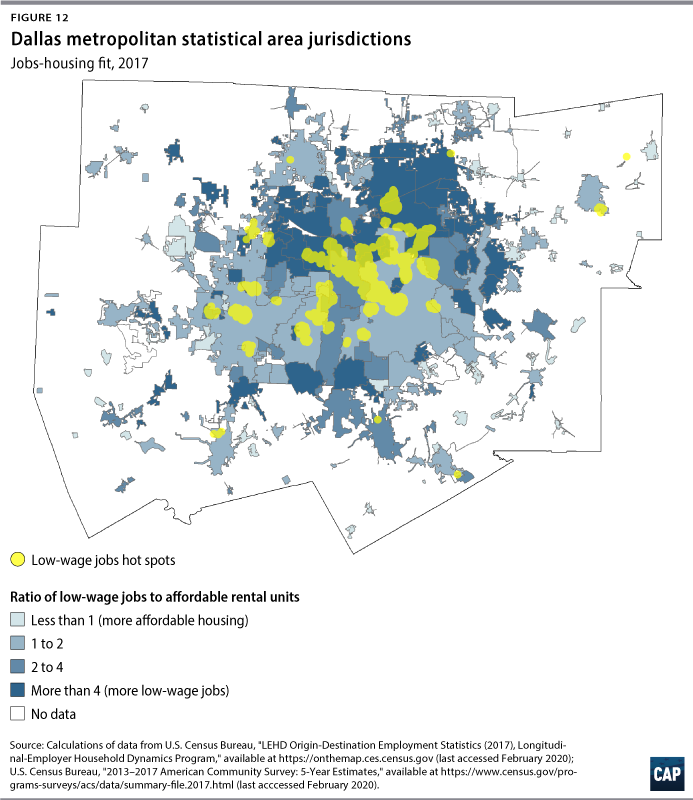
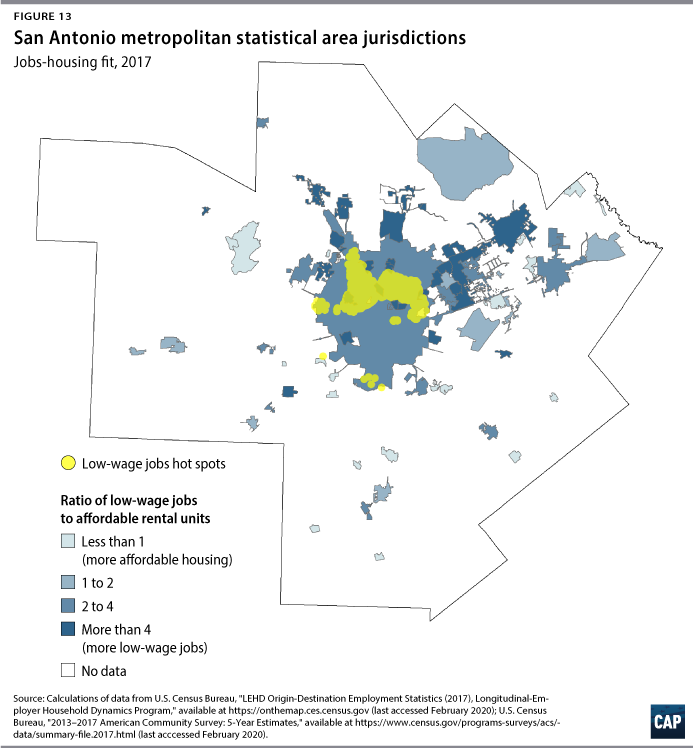
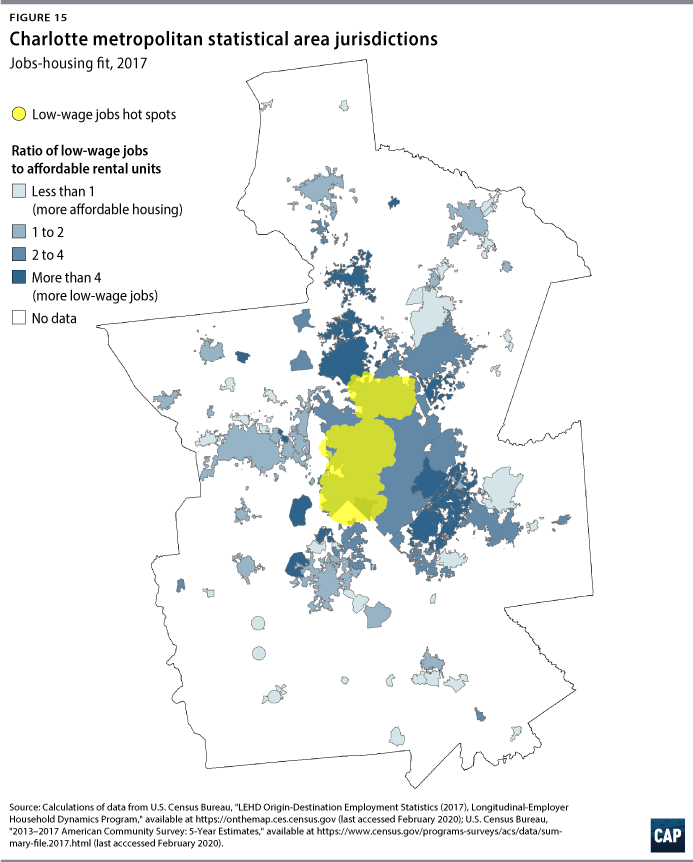
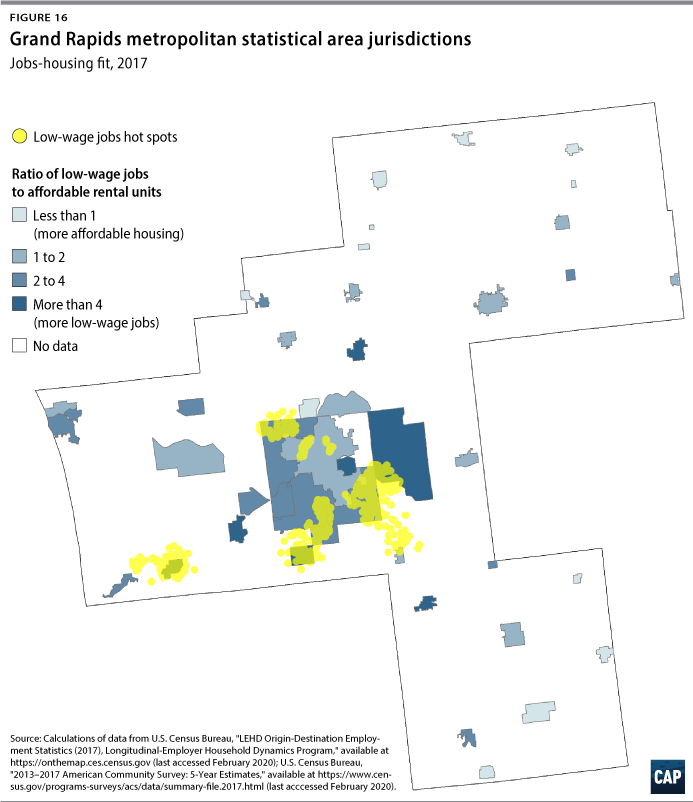
The following figures—Figures 2 through 16—show the low-wage jobs-affordable housing fit metric across the jurisdictions of the selected metropolitan areas. The metropolitan areas are ordered based on the severity of housing affordability for low-wage workers. As in Benner and Karner’s study, large values of the metric indicate that in a jurisdiction, there are more low-wage jobs than rental units affordable to low-wage workers employed in the jurisdiction. Values up to 2 indicate a relatively good fit, whereas values larger than 2 point to a poor fit.61 The maps also highlight the results of a hot spot analysis of low-wage jobs—that is, the analysis of where census blocks with large numbers of low-wage jobs cluster spatially and where such clusters are statistically significant. This analysis was performed to highlight areas where significant concentrations of low-wage jobs occur and to bring attention to the fact that these clusters often cross the boundaries of different jurisdictions. The hot spot analysis, therefore, is useful for underscoring the importance of addressing poor jobs-housing fit outcomes at the regional level rather than at the individual jurisdiction level. In addition, the hot spot analysis offers a tool for strategic planning related to a suitable location for the production of housing and/or the improvement of transportation connectivity to job-rich areas.
The maps show that there are some variations across the metropolitan areas with respect to the geographic distribution of the jobs-housing fit metric. This is not surprising, as the 15 metropolitan areas are very different in terms of size, topography, development patterns, land use, and transportation infrastructure. These factors affect the distribution of jobs and housing across the regions—and consequently the commute patterns and housing affordability of their workforce.62
Los Angeles
The auto-oriented Los Angeles metropolitan area is characterized by a polycentric spatial structure that, rather than feature just a unique central business district, has multiple business cores outside of the original central business district.63 The scattered distribution of low-wage jobs clusters throughout the region mirrors the polycentric structure of Los Angeles. Economic restructuring and demographic changes have had major impacts on the labor market of this region. The post-Cold War decrease in defense investments has been largely responsible for the decline of Los Angeles’ manufacturing sector.64 Manufacturing jobs have decentralized, and the geography of industrial relocation has not resulted in a simple city core-suburb bifurcation found in other classic monocentric metropolitan areas, but rather in the creation of economic nodes throughout the region. At the same time, the sectors based on high-technology production and low-skill services, as well as the business and financial service sector, have continued to expand.65 Los Angeles has attracted immigrants from Asia and Latin America for several decades, contributing to significant population growth since the 1980s. In the past five years, however, population growth has slowed significantly, largely because the metropolitan area struggles with housing affordability and the lack of new home construction.66 Not surprisingly, most jurisdictions in the area display a poor jobs-housing fit. (see Figure 2) Fifty-five percent of renter households in the metropolitan area cannot afford their homes, and only 1 percent of low-wage workers reside in census tracts with a median monthly rent ($697) they would be able to afford. And because of the geography of the area, building new housing is a challenge.
San Francisco and San Jose
The San Francisco and San Jose metropolitan areas constitute the heart of the Bay Area.67 The Bay Area ranks as the fourth-largest metropolitan area in the United States in terms of population. The 7,000-square-mile region is home to 7.6 million people, 25 percent of whom reside in Santa Clara County alone, commonly referred to as the South Bay.68 While up until the 1960s most of the growth was concentrated in San Francisco and the cities immediately surrounding it, growth patterns have changed ever since, as significant expansion has occurred in peripheral counties where developable land was available and where opportunities for annexation existed.69 Since 2007, however, population growth in the Bay Area has slowed, especially in inland areas. Today, the city of San Jose, the unofficial capital of Silicon Valley, represents the most populous city in the region. Together, the San Francisco and San Jose metropolitan areas have led the nation in job creation, innovation, productivity, and median wage growth. The two areas have experienced growing job density in downtown areas and central urban counties,70 largely driven by their high-wage and high-tech knowledge and innovation jobs cluster. According to a Brookings study, San Francisco is among the four largest metropolitan areas that have accounted for 90 percent of the increase in job density from 2004 to 2015.71
The Bay Area has been experiencing a significant shortage of affordable housing. In both metropolitan areas, 45 percent of renter households pay more than 30 percent of their income on housing, and for many, homeownership in the area is out of reach.72 The shortage of affordable housing has led to a surge in the number of commuters who travel 90 minutes or more each way to and from their jobs. Workers employed in service occupations, such as those in the hospitality industry, cannot afford apartments near their jobs and have been moving farther away from their workplaces and to inland areas.73 Only 2 percent and 3 percent of low-wage workers employed in the San Francisco and San Jose metropolitan areas, respectively, reside in census tracts where they can afford the median monthly rent. In 2017, in most ZIP codes in the Bay Area, there were more low-wage jobs than job seekers within a reasonable distance.74 Figures 3 and 4 indicate that most jurisdictions in the two metropolitan areas feature a poor jobs-housing fit, which is consistent with the Benner and Karner study. This is particularly evident in the area surrounding Silicon Valley as well as in the southern part of Alameda County, the western part of Contra Costa County, and the southeastern part of Marin County. Large clusters of low-wage jobs are in the core cities of San Francisco and San Jose, and several smaller clusters are scattered throughout the region.
Miami
Miami is characterized by deep spatial inequalities, with affluent residents living along the coast, in and around downtown, and close to knowledge-based businesses and institutions, whereas low-income households, especially people of color, reside in pockets of concentrated poverty located in the suburban periphery and with poor access to good-paying jobs.75 Similar to other coastal metropolitan areas such as Los Angeles and San Francisco, Miami suffers from a severe housing affordability crisis. Nearly 60 percent of the metropolitan area’s renter households cannot afford housing costs, and only 3 percent of low-wage workers employed in the region reside in census tracts with median monthly rents ($631) that they could afford. Not surprisingly, nearly all jurisdictions in the area display a poor jobs-housing fit—not just in coastal areas but also inland, and particularly north of the city of Miami, where most of the low-wage job clusters are located. (see Figure 5)
Riverside
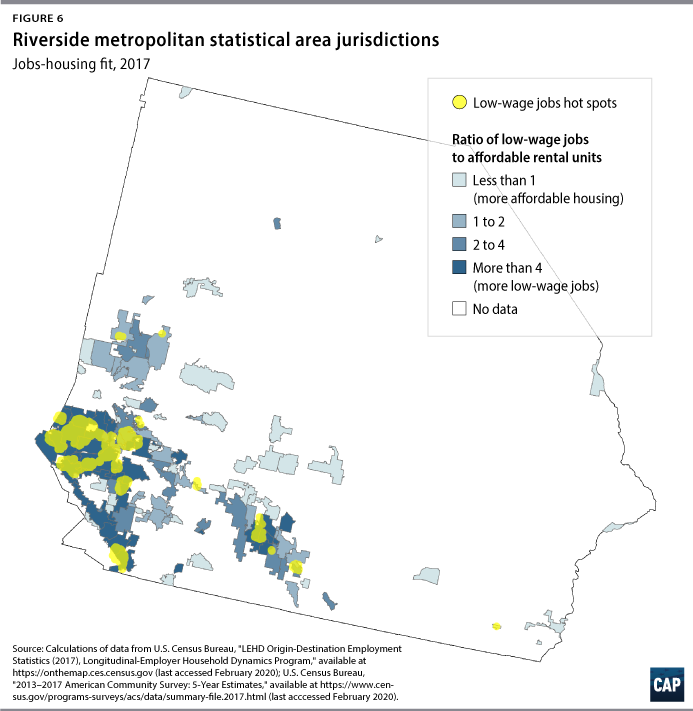
Low-wage jobs have accounted for 74 percent of all employment growth in the Riverside, California, metropolitan area from 2009 to 2013.76 This is not surprising, as the Riverside area has become a major distribution hub and the location for large employers. Thousands of new jobs have been added to the local economy, and the area has absorbed much of the spillover of residents moving from Los Angeles.77
The economic and population growth has posed a significant pressure on the local housing market, which, although it is not as tight as that of Los Angeles, shows signs of stress. The rental vacancy rate has plummeted from 10.4 percent in 2010 to 3.8 percent in 2017. (see Table 2) Fifty-five percent of renter households spend more than 30 percent of their income on housing costs, and only 8 percent of low-wage workers employed in the metropolitan area reside in census tracts they can afford. Figure 6 shows that the jurisdictions adjacent to Los Angeles County display a poor jobs-housing fit and feature large clusters of low-wage jobs. Interestingly, a poor jobs-housing fit is starting to emerge in the eastern part of the region as well, most likely because of an economic and residential growth pattern that is spreading from saturated areas toward more peripheral jurisdictions.
Denver
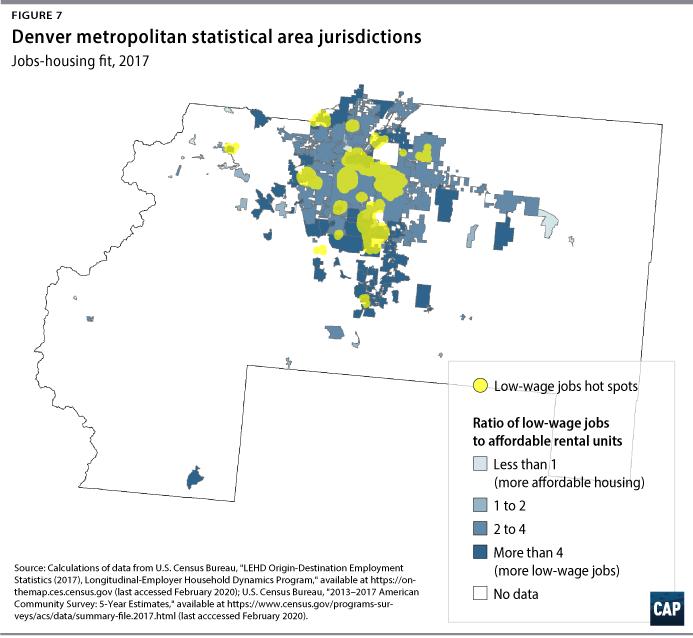
The Denver metropolitan area followed the typical auto-oriented Sun Belt city development pattern during the 20th century as it experienced intense sprawl and city-center population decline up until the mid-1990s. In more recent decades, Denver has taken steps to reverse its course, even though sprawl continues throughout the larger region. Those residing outside the metropolitan core are predominantly dependent on private automobiles, despite significant improvements in the public transit infrastructure.78
An area that has grown in popularity, including among foreign investors, Denver has seen its housing prices skyrocket in recent years.79 Forty-nine percent of the metropolitan area’s renters cannot afford their home. (see Table 2) The shortage of affordable housing is particularly severe for low-wage workers, only 9 percent of whom reside in census tracts with a median monthly rent ($817) they can afford. (see Table 3) Most jurisdictions in the Denver area feature a poor jobs-housing fit. (see Figure 7) Interestingly, the jobs-housing fit tends to be worse in the outmost jurisdictions surrounding Denver than in the metropolitan core itself. The area presents several clusters of low-wage jobs both in the downtown area and in surrounding jurisdictions, especially those in the southern part of the metropolitan area and those located east and northeast of the city of Denver.
Austin
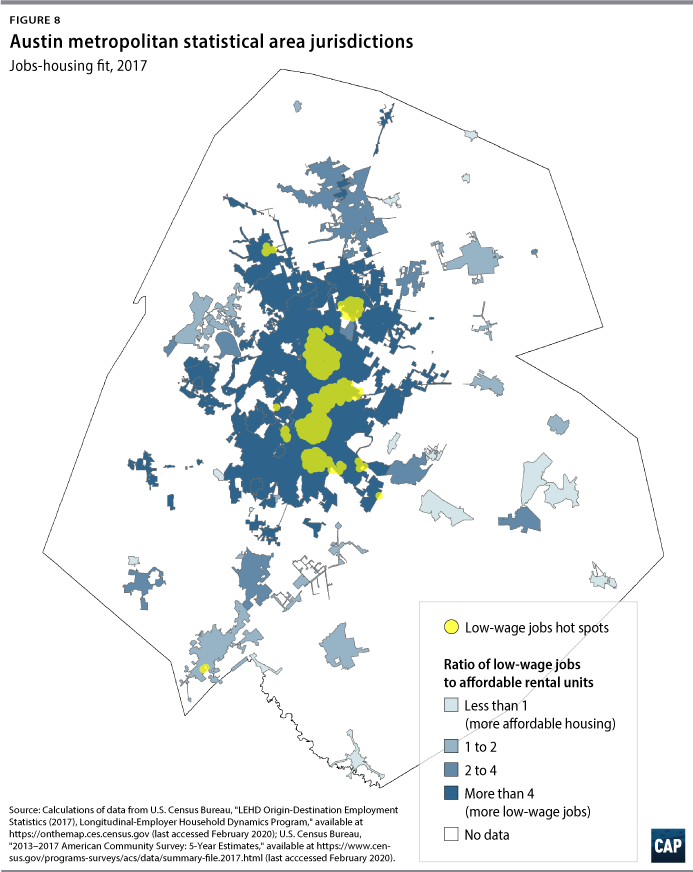
The Austin, Texas, metropolitan area represents a major high-tech hub—information technology, telecommunications, and business and financial services—and is home to several large and small technology companies.80 Jobs have tended to concentrate both in the core city of Austin and in neighboring jurisdictions.81 Approximately half of tech jobs are located in the suburbs outside the downtown area.82 Figure 8 shows that most jurisdictions in the region perform poorly in terms of the low-wage jobs-affordable housing fit, especially those located south and north of the city of Austin. A few large clusters of low-wage jobs are located in core areas. The metropolitan area has a rental affordability problem, as 44 percent of renter households pay more than 30 percent of their income for housing costs. For those who are employed in low-wage jobs, the incidence of this problem is more severe: Only 11 percent of low-wage workers reside in census tracts where they can afford the median monthly rent ($734).
Seattle
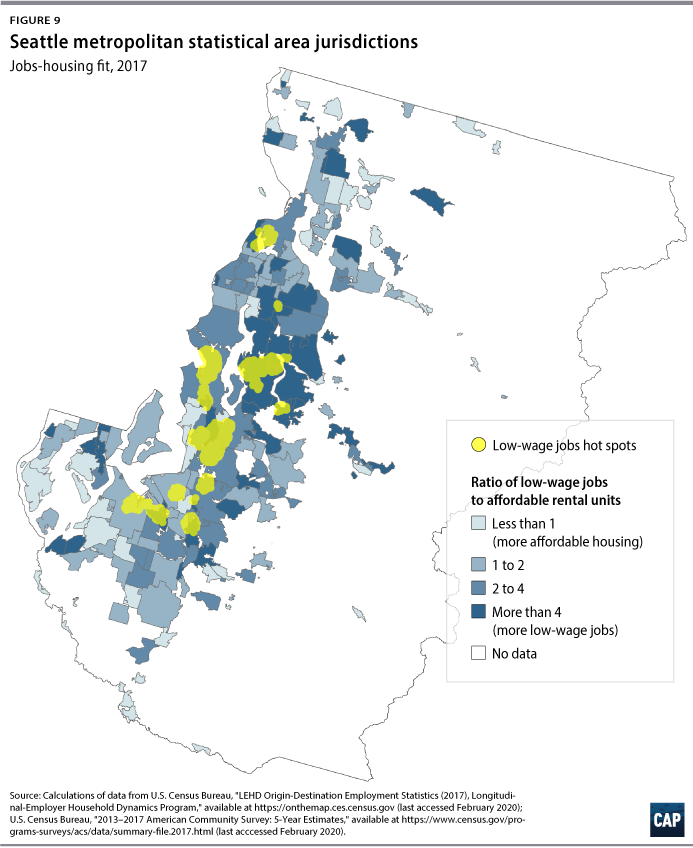
The Seattle metropolitan area is among the U.S. metropolitan areas that have urbanized the most since 2010.83 The city of Seattle in particular has experienced a surge in the development of high-rise apartment buildings largely serving the growing high-tech workforce.84 Like San Francisco, Seattle has experienced a growing job density in downtown and adjacent urban counties,85 largely due to the continued establishment of dozens of high-tech outposts in the region. Google, for instance, recently completed the purchase of about 400,000 square feet of office space in the city east of Seattle. The site includes retail space and a public parking garage. In the meantime, Facebook has opened its 18th office in the area, and Amazon, with more than 50,000 employees in Seattle, is planning more growth in the Bellevue area.86
Like other coastal metropolitan areas, Seattle is experiencing a shortage of affordable housing, despite local efforts to boost multifamily housing supply jointly with massive investment in public transit infrastructure.87 Forty-six percent of the metropolitan area renters experience a housing cost burden, and only 11 percent of the low-wage workforce employed in the area reside in census tracts where the media monthly rent is affordable to them. The rental market has become tighter in the metropolitan area, as the rental vacancy rate has dropped from 6.2 percent in 2010 to 3.4 percent in 2017. Not all jurisdictions in the region, however, experience an imbalance between the number of low-wage jobs and the number of rental units affordable to the local low-wage workforce. Figure 9 shows that the jobs-housing fit is poor in the city of Seattle and predominantly in some central jurisdictions adjacent to the core city as well as in a few places both in the northern and southern parts of the metropolitan area. These are areas where significant clusters of low-wage jobs exist. The jobs-housing fit, however, is relatively good in many peripheral jurisdictions that may house workers who cannot afford rental units in more central locations.
Salt Lake City
The Salt Lake City metropolitan area has experienced unprecedented growth in recent years. Its proximity to outdoor activity resources and its commercial and real estate development have contributed to the area’s attractiveness, especially for high-tech and financial companies such as Adobe, Twitter, and Goldman Sachs. The real estate market in the region has boomed and has appreciated both in the downtown area and in more peripheral areas. The downtown area in particular has experienced a resurgence after the Great Recession.88 This growth has exacerbated the affordable housing problem in the region. Forty-one percent of the metropolitan area’s renters experience a housing cost burden, and only 17 percent of the area’s low-wage workforce resides in census tracts with affordable median monthly rents ($779). Salt Lake City as well as southern jurisdictions are feeling pressure in the affordable housing market, as the distribution of the jobs-housing fit metric illustrates. (see Figure 10) Low-wage jobs are significantly concentrated in the core city as well as in southern jurisdictions.
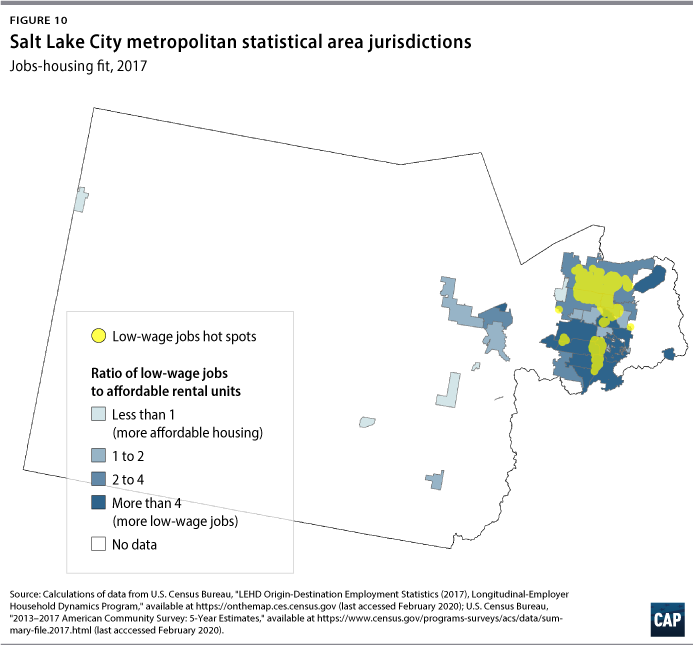
The area’s rapid growth has prompted the city to propose a transit master plan to boost commuters’ accessibility to the workplace. However, the area’s geography represents a challenge with respect to transportation enhancement and further growth. In fact, Salt Lake City is bounded by mountains and lakes that significantly limit the range of options for rail investment and development.89
Atlanta
The sprawling Atlanta metropolitan area encompasses several counties, and a large share of its population of more than 5 million people resides in low-density suburban neighborhoods outside Interstate 285, which forms a ring surrounding the core city of Atlanta.90 In addition, Atlanta is characterized by uneven growth between the northern and southern parts of the region. A substantial share of the metropolitan area’s jobs are located in the northern part of the region, both within the city of Atlanta’s boundaries and its suburbs. Here, infrastructure spending has been focused largely on highways rather than public transit, to the detriment of communities of color concentrated in the southern part of the region. Many of the largest job centers located in the northern part of the region are not served by public transit. Poor public transit connections to job-rich areas and high housing prices in the northern part of the metropolitan area contribute to the further isolation of low-income people largely concentrated in South Atlanta and the southern counties.91 These patterns likely influence the typical commute distance in the region, which according to the Brookings Institution study is 12.8 miles. In the metropolitan area, only one-third of the labor force resides within 10 miles of their workplaces. (see Table 3)
Figure 11 shows that the low-wage jobs-affordable housing fit is poor predominantly in the city of Atlanta and in the northern jurisdictions, consistent with the development patterns described above. Conversely, the fit is good in the peripheral jurisdictions located away from the urban core. Although some small clusters of low-wage jobs can be found south of Atlanta, several large clusters are located in the downtown area, in the northern part of the city, as well as in the northern jurisdictions, where some clusters cross the boundaries of multiple census places and extend to unincorporated suburbs. The analysis of low-wage workers’ census blocks of residence indicates that only 21 percent of low-wage workers employed throughout the metropolitan area live in census tracts with a median monthly rent ($719) that they could afford based on the median earnings of workers with a high school degree or less in the region. (see Table 1)
Dallas
Like Los Angeles, the Dallas metropolitan area features a polycentric urban structure. In the metropolitan area, which is among the top destinations for corporate relocations and has evolved into a major high-tech hub, 17 high-density mixed-use centers have emerged away from the central business districts of Dallas and Fort Worth over the past two decades.92 Fort Worth features greater housing affordability compared with the city of Dallas, where a tight housing supply and rapid population growth have resulted in increasing housing prices.93 The median commute distance in the region is 12.2 miles,94 and only 36 percent of jobs are located within 10 miles of workers’ homes. (see Table 3) While the jobs-housing fit is relatively good in the cities of Dallas and Fort Worth, most northern jurisdictions and a few southern ones fare poorly in terms of the ratio of low-wage jobs to affordable rental units. (see Figure 12) These jurisdictions tend to feature high median monthly rents. Only 31 percent of low-wage workers employed in the metropolitan area reside in census tracts where they can afford the median monthly rent ($764). The distribution of low-wage jobs in the region is consistent with the polycentric nature of the spatial structure, as several hot spots spread throughout the area, often crossing multiple jurisdictions.
San Antonio
The San Antonio metropolitan area features a diverse economy. Its financial sector, tech industry, and manufacturing sector now represent important economic drivers along with the region’s more traditional drivers: health care and tourism. Its relatively low cost of living has increasingly attracted a younger educated population, which has contributed to an urban renaissance in the city of San Antonio. Like Austin, the San Antonio metropolitan area has spread out. In the city of San Antonio, the average neighborhood density has fallen by 5 percent from 2010 to 2016.95 The area has experienced growth first in the inner suburban rings of San Antonio and increasingly in peripheral jurisdictions, particularly in the north—a traditionally exclusively white area.96 As in other metropolitan areas, housing affordability is a problem in the San Antonio area. Forty-seven percent of renters in the area spend a large portion of their incomes for housing, and 68 percent of low-wage workers reside in census tracts where the median monthly rent ($687) is higher than what they could afford. Low-wage jobs are clustered largely in the northern part of the city, as Figure 13 shows. The city as well as adjacent jurisdictions, especially in the north, fare poorly in terms of the jobs-housing fit.
Nashville
Nashville, Tennessee, is a center for sports, entertainment, and hospitality. The area has experienced one of the largest percentage changes in the number of jobs since the wake of the Great Recession, and it is poised to experience further job and population growth over the next two decades.97 The region is also relatively more affordable than other metropolitan areas. Forty-one percent of renter households experience a housing cost burden.
Like other Southern metropolitan regions, Nashville is a sprawling and auto-oriented metropolitan area. This is reflected in the share of the workforce traveling a long distance to commute to work: Only 37 percent of all jobs are within 10 miles of workers’ homes, and the median commute distance is 11 miles. Like in other emerging and sprawling areas such as Charlotte and Grand Rapids, a large percentage of low-wage workers—43 percent—reside in census tracts with an affordable median monthly rent ($753). These census tracts, however, are in the periphery of the metropolitan core. Figure 14 shows that the city of Nashville as well as adjacent jurisdictions fare poorly in terms of the jobs-housing fit metric. This is particularly clear in the rapidly growing jurisdictions south of Nashville, where some large low-wage jobs clusters are located.
Charlotte
Like Austin, the Charlotte, North Carolina, metropolitan area has been growing fast in recent years. Even though jobs have concentrated in the core of the region, they have also tended to spread into less dense suburban areas outside the city of Charlotte.98 The distribution of the jobs-housing fit metric across jurisdictions indicates a shortage of rental units affordable to the low-wage workforce throughout an area that encompasses southeastern jurisdictions and the city of Charlotte, and extends to northwestern jurisdictions. (see Figure 15) A very large cluster of low-wage jobs can be found in the central part of the metropolitan area, occupying a substantial portion of the city of Charlotte. In contrast with Atlanta and Austin, however, the rental affordability problem for low-wage workers mirrors that of renter households at large. Forty-nine percent of low-wage workers employed in the area reside in census tracts with a median monthly rent ($727) they can afford. Some of the peripheral jurisdictions featuring a good jobs-housing fit and a larger supply of affordable housing may be feeding low-wage workers to central areas where jobs are concentrated.
Grand Rapids
While it had lost 12.1 percent of its jobs during the 2000s, the Grand Rapids, Michigan, metropolitan area has experienced a significant economic and population rebound since 2010. The Grand Rapids area differs from the other metropolitan areas discussed in this report in that much of the job growth has occurred in manufacturing, especially in office furniture, aerospace, autos, and medical devices. Other sectors have been growing as well: professional and business services, education, health care, and leisure. The economic growth is particularly visible both in the downtown area, where office vacancy rates have significantly declined in recent years, and in suburban areas.99
Figure 16 indicates that the jobs-housing fit is good in the city of Grand Rapids but is poor in the adjacent jurisdictions, particularly east of the core and in small jurisdictions throughout the region. Large low-wage job clusters are located outside the downtown area. Sixty-four percent of low-wage workers reside in census tracts with an affordable median monthly rent ($731)—the highest percentage across this report’s sample of metropolitan areas, suggesting that many workers may be commuting to work from affordable neighborhoods located in the periphery of the metropolitan core.
Takeaway
In summary, low-wage jobs are not evenly distributed throughout each metropolitan area analyzed in this report. When their geographic distribution is compared with that of rental units affordable to low-wage workers, it is clear that in most areas, a low-wage jobs-affordable housing fit that is poor characterizes many of the jurisdictions where low-wage jobs tend to be concentrated. These jurisdictions feature a shortage of affordable housing for low-wage workers employed within their boundaries.
Recommendations
To ensure that metropolitan economies and labor markets recover rapidly, function equitably, and are competitive, paying attention to the spatial distribution of affordable housing and jobs is important. It is equally critical to promote access to jobs for workers at all income levels, but particularly for low-wage workers experiencing significant barriers that can undermine their likelihood of reaping the gains associated with regional economic growth. As this report has discussed, too often, the shortage of affordable housing results in low-wage workers either residing away from job-rich areas and facing long commutes or residing close to their jobs and spending a very large portion of their income on housing costs. In either case, the quality of their lives and that of their families risks being eroded.
Adding jobs to a metropolitan region may represent a positive economic outcome in the aggregate. But if there is a shortage of affordable housing for the workforce at different income levels, employers may not be able to attract and retain workers. It is important to increase the overall supply of affordable housing units and provide a broad range of housing options, as discussed in the Center for American Progress’ “Homes for All” report.100 Adding new affordable units to a given housing market, however, will not completely solve the housing supply problem unless newly built and rehabilitated affordable housing fits the needs of a range of incomes, particularly those at the bottom of the income spectrum. It is important to better connect low-wage workers with their workplace by strategically creating affordable housing near jobs and accessible transit options. This strategy would benefit not just the low-income workforce, by lowering their housing and transportation costs, but also transit providers, by stimulating ridership. It would ultimately benefit the regional economy as well. In addition, the need to rethink work and housing after the COVID-19 pandemic makes this challenge even more pressing. Focusing on affordable housing investment would provide a much-needed opportunity for job creation in the construction industry, especially in high-cost metropolitan areas.
Invest in MLTs for the establishment of eTODs
As the analysis presented in this report indicates, in any given metropolitan area, there may be jurisdictions that perform better than others in terms of the jobs-housing fit. Usually, clusters of low-wage jobs cross the boundaries of individual jurisdictions. Furthermore, peripheral areas are often the only options available to low-income families but are not well connected to both central and suburban job-rich areas. Therefore, addressing any poor jobs-housing fit ought to be a regional effort.
CAP recommends the federal government make a large-scale direct investment in metropolitan land trusts on which equitable transit-oriented developments can be established, particularly in areas where the low-wage jobs-affordable housing fit is poor, in proximity to low-wage job hot spots, and where public transit connects the low-wage workforce to clusters of low-wage jobs. MLTs would be a metropolitanwide version of community land trusts (CLTs): nonprofit community-based organizations that acquire land within a specified geographic area, removing it from the speculative real estate market by retaining ownership of the land in perpetuity. CLTs then lease the land to homeowners or other entities that own the buildings developed on the land, including, among others, nonprofit developers of rental housing. The housing is then provided to tenants at permanently affordable rents.101 MLTs would differ from the classic CLT model in that they would operate at a metropolitan scale by strategically acquiring and stewarding several scattered sites. MLTs would be locally organized consortia formed through the partnership of existing CLTs; local government housing and transportation agencies; local housing authorities; mission-driven nonprofit organizations; and community development financial institutions. The consortia would be governed by a combination of members and local officials and overseen by the U.S. Department of Housing and Urban Development (HUD) to prevent housing discrimination and to ensure the proper use of funds. Through these partnerships, MLTs would increase their capacity, diversify their holdings to include rental housing and mixed-use development, and maximize the overall number of affordable units throughout a metropolitan area, especially in job-rich areas where the demand for affordable housing is strong.
On the other hand, eTODs apply an equity lens to the traditional TODs in order to ensure that the benefits of TODs accrue to low- and moderate-income families rather than predominantly to high-income residents. (see text box) Specifically, eTODs prioritize the development of affordable housing near public transportation to benefit low-income residents.102
Transit-oriented developments
The concept of TOD emerged in the late 1980s when architect and urban planner Peter Calthorpe coined the term to refer to a compact, walkable, mixed-use community developed near transit services and with good access to jobs, services, and amenities. TODs have the potential to reduce people’s dependence on driving, cutting down their transportation expenses and improving their quality of life while boosting overall ridership, curtailing environmental impacts on the region, and creating stable mixed-income communities.103 High development costs and a shortage of developable land, along with zoning regulations such as single-use zoning, density limits, and parking requirements, often complicate the development of TODs. Most importantly, high development costs and scarce land supply often contribute to an increase in property values within and around TODs, which in turn create barriers to entry for low-income residents, increase their probability of experiencing a housing cost burden, or lead to their displacement and to gentrification.104 In addition, landlords in neighborhoods where housing prices increase because of their proximity to transit tend to opt out of programs that restrict rents for an established length of time.105 Similar repercussions occur when the expansion of transit lines spurs demand for housing within walking distance from transit stops. Property values tend to increase in anticipation of transit development.106 This demand leads to higher rents and home prices and often to the displacement of incumbent low-income residents who can no longer afford housing in locations featuring improved transit connectivity. Several localities, including some of the metropolitan areas analyzed in this report, have been promoting the development and preservation of affordable housing in TODs through a variety of funding streams.107 Cities such as Seattle,108 Denver,109 Austin,110 Los Angeles,111 Atlanta,112 and those in the Bay Area,113 among others, have undertaken major initiatives and established TOD funds to promote TODs along their transit corridors. Given the persistent shortage of affordable housing and poor accessibility to employment centers in these areas, however, much work still needs to be done and brought to a larger scale.
Robert Hickey’s working paper114 on the possible role of CLTs in fostering eTODs provides a useful account of the opportunities and challenges related to the engagement of CLTs in the development of eTODs as well as a discussion of three case studies: the city of Atlanta, the Denver region, and the Twin Cities, Minnesota, region. Land in TODs tends to be more expensive than land outside them.115 When developing affordable housing in TODs, developers may need larger subsidies than those that are currently available, because of fixed construction costs, higher upfront costs, and lower rent revenues associated with affordable housing.116 Most importantly, areas in which affordable rental units are developed through federal funding vehicles such as the Low-Income Housing Tax Credit (LIHTC) program may not ensure long-term affordability because of expiring affordability covenants. MLTs that are established with substantial subsidies, incentives, and regulatory assistance by the federal government could help address these challenges and ensure that housing in eTODs is affordable for many low-income workers and their families in the long run and at the needed scale. Some more recommendations are provided below.
Align federal transportation funding with affordable housing production
The high fixed costs associated with land acquisition and construction represent a major barrier for both the establishment of MLTs and the development of affordable housing in eTODs. For MLTs and eTODs to achieve scale, it is necessary to aggressively subsidize the costs of land acquisition and development. Reducing the costs of construction of eTOD housing would ensure that a larger amount of affordable housing units can be injected in the housing market compared with the amount of affordable housing created with current funding channels. Establishing eTODs on MLT land would further ensure that affordability can be maintained in the long run. As in the “Homes for All” proposal, CAP recommends that the federal government provide direct capital grants for the development of affordable rental units in conjunction with the expansion of public transit in eTODs. Federal capital grants should be directed to states that support the expansion of the eTOD-MLT model.
Federal transportation policies typically prioritize spending on highway projects rather than transit investments. The latter generally require very large contributions by states and local government.117 Since the development of eTODs depends on the availability of capital for concurrent transit expansion and affordable housing development, the federal government should play a more aggressive role in transit funding, and Congress should appropriate funding for a dedicated capital grant program that aligns and subsidizes transit and affordable housing initiatives coordinated by the Federal Transit Administration (FTA) and HUD. A critical element of the program would be the requirement that a portion of the funding is set aside for the establishment and expansion of MLTs stewarding land on which eTODs can be developed. The proposed program would be designed to complement existing local and regional initiatives, such as the Denver Regional TOD Fund and the eTOD fund established by the San Francisco Bay region’s Metropolitan Transportation Commission, as well as current state and federal programs, such as the LIHTC program, the National Housing Trust Fund, and the FTA’s Major Capital Investment Projects program, also known as New Starts.118 Extra points should be awarded to qualified allocation plans that prioritize developments near transit as part of the LIHTC program,119 currently the major source of funding for affordable housing development. States should adopt lasting affordability in their qualified allocation plans for the LIHTC program, thus giving MLTs a greater opportunity to be considered for this type of funding.
Mandate inclusionary housing at the state level
Considering the regulatory environment in which affordable housing is incentivized, planned, and produced is critical for affordable rental units to be strategically located where they are needed the most: close to jobs and to rapid transit corridors and hubs. An explicit governmental mandate that requires developers to provide affordable housing units in eTODs is necessary for affordable housing to be tactically produced at the needed scale. States should allocate affordable housing obligations to every jurisdiction, with appropriate incentives, such as density bonuses,120 for jurisdictions located in regions with significant current and projected job growth.
Some states already have housing and land-use policies that promote affordable housing development in areas of opportunity. Some of these policies are the result of court-ordered mandates, and sometimes they override local zoning or planning board decisions.121 A scan of existing inclusionary housing programs suggests that some strategies are effective in maximizing inclusionary housing compliance.122 For instance, state legislatures should pass new laws that give governors the authority to overturn local exclusionary zoning and require that zoning be supportive of meeting affordable housing needs by right—through, for instance, by-right zoning.123 Buyout options—through which developers are allowed to pay an in-lieu fee to contribute to an affordable housing fund rather than include the development of affordable units in a new project124—should be limited. In addition, tying housing development funds to transportation programs, along with administrative incentives and the judicial threat of a court-ordered requirement, would put teeth to the compliance process. For example, noncompliant communities would not be eligible for various federal and state loans and grants, whereas compliant localities and metropolitan areas would receive priority in funding.
Prioritize rental housing and allocate larger proportions of developed units to affordable housing
Existing CLTs focus predominantly on homeownership. It is important that MLTs become more involved largely in the development and stewardship of rental housing, especially for the low-income workforce.125 MLTs should acquire and steward land in job-rich urban and suburban areas and in neighborhoods close to public transportation. Most importantly, eTODs developed on MLT land should set aside a much larger proportion of affordable housing units compared with developments currently funded through the LIHTC program. This proportion should represent at least 70 percent of all eTOD units developed throughout a metropolitan area. Increasing allowable densities on MLT land on which eTODs are developed, along with other cost-reducing strategies such as lowering parking requirements and streamlining the permitting process, would support a larger set-aside of affordable housing units. As recommended in CAP’s “Homes for All” proposal, when feasible, eTODs should adopt a mixed-income, mixed-use approach and generate different types of housing units that can accommodate different types of households. A mixed-use approach in particular could enhance MLTs’ revenue stream.
Facilitate the acquisition of developable land
The availability of developable land represents a significant challenge, especially in high-cost and dense areas. To support the co-establishment of MLTs and eTODs, however, there are some opportunities and best practices that could be followed. For instance, local governments could facilitate the acquisition by MLTs of old commercial zones, such as underused parking lots and idle or decaying malls and business corridors. Also, public transit agencies could provide property at discounted prices or transfer surplus land assets to local governments for the establishment of MLTs. In Seattle, for instance, Sound Transit126 has committed to converting surplus property that has been acquired for transit expansion into affordable housing as part of current TOD initiatives.127 It is also important to purchase land before transit lines are expanded and stations are open. As Hickey emphasizes,128 public transit expansions provide CLTs an opportunity to acquire land before investment in transit stations, new amenities, and infrastructure increase land values and make housing unaffordable for low- and moderate-income families.
Conclusion
Regional economies cannot function without lower-wage workers. Therefore, addressing housing affordability for this segment of the workforce is essential to ensure a rapid economic recovery after the COVID-19 pandemic and continued regional economic dynamism.
It is important from a social equity perspective to ensure that low-wage workers benefit from economic recovery, job growth, and economic development. The mere addition of new jobs to metropolitan areas with strong economies cannot ensure that all residents have equal access to economic opportunities unless the supply of affordable units to house the local workforce is sufficient. The distance from jobs affects both employees and employers. Furthermore, the shortage of affordable housing undermines the economic competitiveness and productivity of metropolitan areas, as high housing costs affect the ability of regional economies to attract new firms and businesses and expand existing ones.
It is important to better connect low-wage workers with their workplaces by strategically creating affordable housing near jobs and accessible transit options. Ensuring that the local housing supply fits locally employed low-wage workers’ ability to afford it is key to addressing social equity, as doing so would lead to shorter commutes, an improved quality of life, and a boost in disposable income and savings opportunities for this large and essential segment of the American workforce.
About the author
Michela Zonta is a senior policy analyst for Housing and Consumer Finance Policy at the Center for American Progress. She has extensive research, teaching, and consulting experience in housing and community development. She has published work on the government-sponsored enterprises, mortgage-lending practices of ethnic-owned banks in immigrant communities, jobs-housing imbalance in minority communities, residential segregation, and poverty and housing affordability. Zonta holds a bachelor’s degree in political science from the University of Milan, as well as a master’s degree and a doctorate in urban planning, both from the University of California, Los Angeles.
Acknowledgements
The author wishes to thank Zelalem Adefris, Charles Brennan, Rejane Frederick, Kevin DeGood, Andy Green, Tiffani Lennon, Virginia Parks, Jason Richardson, James H. Spencer, Andres Vinelli, and Will White.
Appendix