Last fall, the U.S. Department of Education released an extensive set of higher education data containing never-before-seen metrics on student outcomes. Known as the College Scorecard, the new data aim to provide consumers with better information on how colleges stack up against each other and to help students make better decisions when choosing a college. For higher education researchers and policymakers, the scorecard’s new performance indicators on student loan repayment rates, earnings, and graduation and transfer rates provide a new opportunity to assess how well the nation’s colleges are serving students.
Scorecard completion data
College completion rates on the scorecard are particularly noteworthy. The scorecard contains information on the shares of students receiving federal financial aid who completed, transferred, or are still enrolled two, three, four, six, and eight years later. These data make it possible to see how completion rates change within a cohort over time. Even better, the scorecard reports these data for students entering any of the nation’s colleges from 1997 through 2007; for more recent years, data up to eight years ago are not yet available. Plus, the scorecard disaggregates data by key student characteristics, such as income upon entering college, dependency, sex, first-generation status, and Pell Grant receipt.
The scorecard data can improve upon other federal measures of college completion. For example, the most commonly used federal graduation rate only tracks students who fit a specific cohort: students who never enrolled anywhere else and attended full time. The problem with this measure is that it excludes part-time students—individuals who make up 59 percent of all undergraduates. It also fails to track outcomes for students who transfer into or out of a college, which represents about 37 percent of undergraduate students. Both of these types of students are captured in the scorecard data if they receive federal aid.
This is not to say that the scorecard data are perfect. For one, they are limited to students who receive federal financial aid—a category that encompasses 70 percent of all enrolled students. While this represents a majority of overall enrollment, the share of students receiving federal aid can vary by school. This means, for example, that the data provided by elite colleges—which perhaps have a lower share of students in need of financial aid—may not be representative of the school’s overall outcomes. In addition, schools with small cohorts of students may have their data suppressed to protect student privacy, making outcomes unavailable for analysis. Finally, the Center for American Progress’ review of the data suggest that some colleges do not accurately or thoroughly report student outcomes, listing a high percentage of students under an “unknown” completion category.
To get a sense of how completion rates for federal financial aid recipients have changed over time, this charticle looks at the scorecard’s results for students who entered public four-year colleges from 2002 to 2007, up to six years after enrolling.
Here is a detailed look at some of the main findings:
At public four-year colleges, completion rates are improving each year
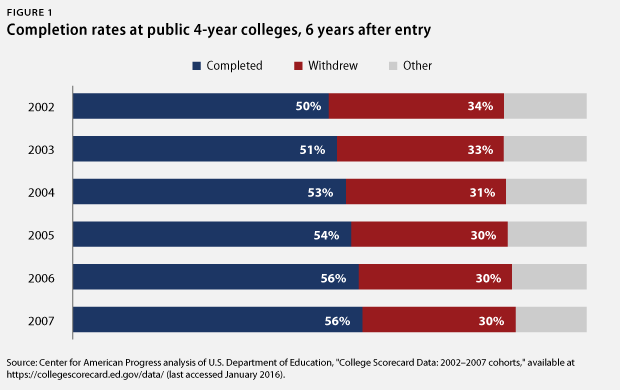
At public colleges, college completion rates are slowly improving, increasing 6 percentage points overall from 2002 to 2007. Fifty-six percent of federally aided students who enrolled in public four-year colleges in 2007 graduated within six years of entering. This is an improvement over students who first enrolled in 2002, only half of whom graduated in six years.
While a 6 percentage point increase may not sound impressive, such growth is particularly noteworthy because it occurred even as the overall number of students entering colleges increased. Between 2002 and 2007, enrollment at four-year public colleges grew approximately 6 percent. This combination of greater enrollment and improved completion rates translates into about 1 million more students receiving bachelor’s degrees.
College completion rates are increasing for low-income students
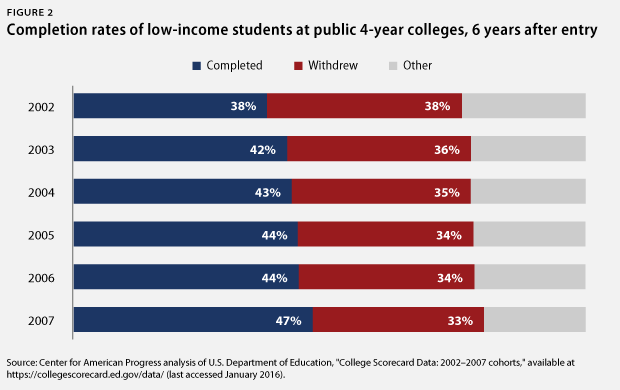
Low-income students at public four-year colleges are also seeing a rise in completion rates. Students who entered college in 2007 had a 46 percent completion rate six years after entering, compared with a 37 percent completion rate for students who entered in 2002. After accounting for increases in enrollment among low-income students, this 9 percentage point increase in completion translates to about 200,000 more low-income students receiving bachelor’s degrees from public colleges.
This increase in college completion rates does not, however, lessen concerns about the gap in completion by income. In 2007, approximately 56 percent of students at public four-year colleges graduated within six years. For low-income students, the rate was 10 percentage points less.
College completion rates are improving even as two-year retention rates remain unchanged
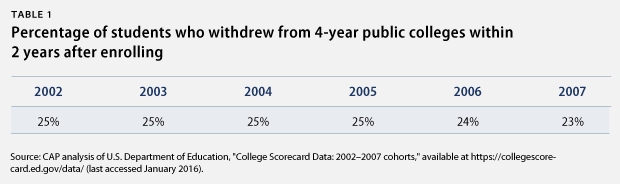
Interestingly, the growth in completion rates has not been accompanied by a substantial decrease in the share of students who drop out early in their college careers. At four-year public colleges, about one-quarter of students who enroll drop out within two years; this has not changed much over time. After accounting for increases in enrollment, this suggests that colleges may be doing a better job of decreasing the share of students who drop out after two years. But it also shows that in order to see more significant improvements in completion, colleges need to stop losing nearly one-quarter of their students after just two years.
Outcomes at public colleges vary significantly by state
Completion rates at public four-year colleges—measured here using the 2007 cohort six years after entry—vary significantly by state. Iowa, the highest-performing state, has a college completion rate that is 20 percentage points more than the national average and 39 percentage points more than the completion rate of Montana, one of the lowest performers. Most states graduate a majority of their students after six years, while Montana is barely graduating one-third of enrolled students.
This list intentionally excludes nine states: California, New York, Florida, Alaska, Nevada, Oklahoma, Hawaii, Utah, and New Mexico. This is because each of these states has listed more than 10 percent of its public college students under an unknown completion category, a move that could potentially result in misleading completion rates. For example, New Mexico has a 38 percent completion rate, but 28 percent of students have their completion status listed as unknown. Actual college completion for the state could be as high as 66 percent. New Hampshire, on the other hand, has the lowest unknown rate, with just 2 percent of students listed under this status.
Data limitations
While CAP’s analysis of college completion data turned up several interesting points, it also revealed several limitations that narrowed the scope of the analysis. These challenges are important to highlight for future research.
First, the quality of reporting for large numbers of students appears to be poor. Some sectors had high shares of students with an unknown completion status. This is particularly a problem with older data and among community colleges. For example, 44 percent of federally aided students who entered community college in 1999 had an unknown status after four years. This limitation hampers efforts to disaggregate some completion data.
Second, even if the unknown completion rate is not high, data still may not be available due to data suppression. To protect student privacy, some data are hidden and not available for analysis when cohorts are small. Data suppression varies by sector. At for-profit four-year colleges, suppression rates are near 0 percent in recent cohorts, meaning that all completion and withdrawal rates are visible. Suppression rates reach a high of 8 percent among older cohorts in the private nonprofit and for-profit two-year sectors.
Third, the interplay between both privacy suppressed data and the share of students with unknown completion can be problematic and lead to inaccurate conclusions, particularly for disaggregated data. For example, data for the 2000 cohort of low-income students has a privacy suppression rate of 14 percent, and 17 percent of students have an unknown completion status. Combined, data are not known for 31 percent of students in the cohort.
For these reasons, CAP’s analysis focuses on the most recent cohorts at four-year public colleges.
Lastly, as mentioned, the scorecard data include the ability to disaggregate by a number of population characteristics. While this is an important and useful function, some measures are less reliable than others. For example, colleges were not required to report completion status for Pell Grant recipients until 2012, so the Pell Grant indicator is not considered accurate and was not used in this analysis. While completion rates are included for low-income students, CAP was not able to include data for middle- and high-income status due to high occurrences of unknown completion status and privacy suppressed data.
Conclusion
This analysis shows that overall, college completion rates are headed in a positive direction, including for low-income students. While a majority of students are graduating within six years, some states lag far behind and need to improve. Going forward, more emphasis needs to be put on improving college completion, particularly for populations with lower graduation rates.
Antoinette Flores is a Policy Analyst on the Postsecondary Education Policy team at the Center for American Progress.