The oil and gas industry is one of the most lucrative industries in the United States. Its five largest companies—BP, Chevron, ConocoPhillips, ExxonMobil, and Shell—have earned more than $1 trillion in profits over the past decade. Yet this industry still fights tooth and nail to cling to its special tax provisions, worth at least $40 billion per decade. One of Big Oil’s most repeated rationales for keeping its exceedingly generous tax breaks, despite oil companies’ enormous profits, is its contribution to the U.S. employment numbers. However, a close look at Big Oil’s claims finds that this employment effect is greatly exaggerated. In fact, our analysis of government employment data identified far fewer direct jobs than the numbers hyped by the oil and gas industry. Furthermore, gas station employees—low-paid workers who sell convenience store goods and petroleum products—make up nearly half of the direct jobs.
Since 2009, the American Petroleum Institute, or API, has repeatedly claimed that the oil and gas industry has supported more than 9 million jobs in the United States. In written testimony before the Senate Committee on Energy and Natural Resources in 2013, API President and CEO Jack Gerard asserted, “Currently, the entire natural gas and oil industry supports 9.2 million U.S. jobs; accounts for 7.7 percent of the U.S. economy and delivers $86 million per day in revenue to our government.” These figures came from a 2009 PricewaterhouseCoopers, or PwC, study, which was paid for by API and employed economic impact modeling to determine direct, indirect, and induced employment impacts using 2007 data.
In 2013, API funded a subsequent PwC study, which found that 9.8 million jobs were supported by the oil and gas industry in 2011, an increase of about 7 percent when compared to its 2007 job impact estimate. Once again, the study included estimates of direct, indirect, and induced oil and gas industry job effects. But are the API-commissioned studies inflating oil and gas industry employment?
To answer that question, we examined data from the Bureau of Labor Statistics, or BLS, which is housed within the U.S. Census Bureau and provides employment data for upstream and downstream oil and gas industry activities. Upstream activities include oil and gas extraction, well drilling, and operation support. Downstream activities consist of petroleum refining, product sales through dealers and gas stations, and pipeline construction and transportation.
In contrast to the PwC jobs numbers, our employment count does not include indirect jobs created by the oil and gas industry, such as those in the electric utility industry, because these estimates are often subjective and can be difficult to quantify. In May 2012, the U.S. Chamber of Commerce called the measurement of indirect jobs an “inexact science.” Both PwC studies took into account these indirect employment effects, as well as the induced employment impacts that occur as the income generated by direct and indirect jobs supports employment in other, unrelated industries. These induced impacts, however, are often debatable and highly dependent on economic conditions.
Because it can be argued that every job has some type of multiplier effect, it is important to focus on the jobs directly created by an industry in order to understand and compare employment impacts on a level playing field. Table 1 shows the direct jobs created by the oil and gas industry between 2007 and 2013, including gas station jobs, as a percentage of total employment.
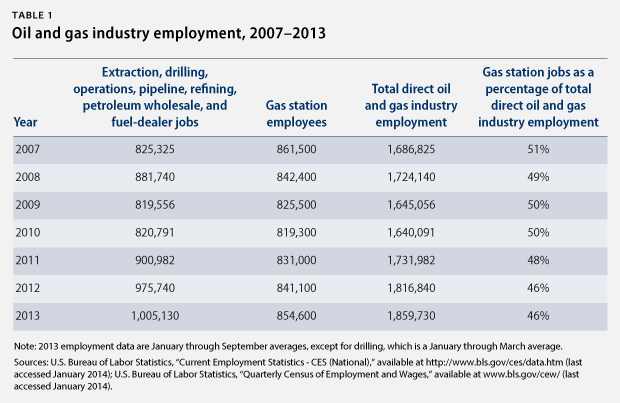
Table 1 provides a look at the employment makeup of the oil and gas industry from 2007—the year that the first PwC study analyzed—to 2013. It also shows that gas station employment currently makes up nearly 50 percent of total direct oil and gas industry employment. This means that the single-largest category of workers in the industry includes low-paid cashiers and attendants who also sell nonpetroleum products, such as cigarettes and snacks.
The PwC estimates of direct jobs are higher than our estimates because the former include activities that could essentially be counted under other industries, including natural gas distribution, asphalt-paving- and roofing-materials manufacturing, and petroleum-based lubricants and grease manufacturing. Natural gas distribution is part of the utility industry and is listed under the category “utilities” in the BLS database. While petroleum products are one of the largest inputs used in asphalt-paving- and roofing-materials manufacturing, these jobs are in the manufacturing sector. And petroleum-based lubricant manufacturing should also be classified as manufacturing. So the PwC direct job estimates are inflated by including these three activities that are not part of the oil and gas industry.
However, the difference between our figure and PwC’s is mostly related to the oil and gas extraction jobs. The second PwC study found that extraction accounted for 783,800 jobs in 2011, while BLS data indicate that there were only 172,000 extraction jobs—a difference of more than 600,000 jobs. Interestingly, we found that the seasonally adjusted employment figure for mining at the end of 2011 was 783,100 in the BLS database. This suggests that PwC used this overall figure that includes oil and gas well and extraction jobs but also counts mining and quarrying jobs related to coal and other mineral solids. Therefore, the number used by PwC is, once again, inaccurate.
While not insignificant, the 1.9 million direct oil and gas jobs paint a much more realistic picture of oil and gas industry employment when compared to the 9.8 million jobs figure that API routinely touts. Even the direct employment findings from PwC seem inconsistent with BLS data and only serve to inflate the overall employment impact of the oil and gas industry.
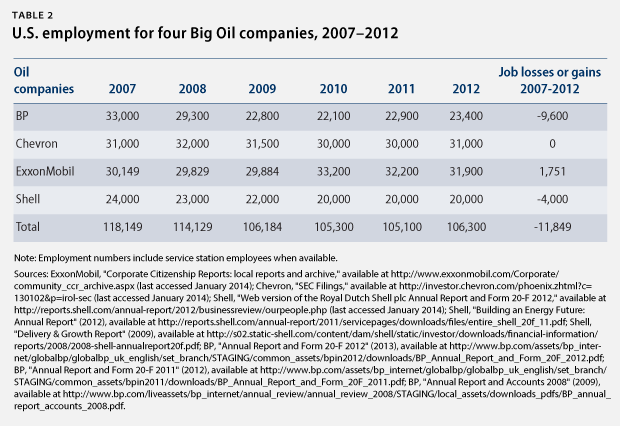
Even with the tax breaks, the combined employment figure for four of the big five oil companies was lower in 2012 than in 2007. BP, Chevron, ExxonMobil, and Shell have shed a net total of nearly 12,000 U.S. jobs since 2007, as Table 2 shows below. During that same time period, these four companies earned a combined total of more than $600 billion in net profits.
The bottom line is that the $4 billion in annual Big Oil tax breaks supports less than 2 million direct jobs—nearly half of which belong to low-paid gas station employees. Unfortunately, huge profits and permanent tax breaks have not meant more jobs for some of the biggest oil companies. These tax breaks seem to benefit Big Oil executives and its largest shareholders, rather than keep nearly 10 million people at work, as the industry claims.
Methodology
To calculate oil and gas industry direct employment data, we used the Current Employment Statistics, or CES, database and the Quarterly Census of Employment and Wages, or QCEW, database, which are administered by the U.S. Bureau of Labor Statistics. We pulled the average annual, nonseasonally adjusted employment data for 2007 through 2012 from the CES database for the following activities: extraction, operation support, pipeline construction, petroleum refineries, pipeline transportation, fuel dealers, petroleum wholesalers, and service stations. Because the annual average was not yet available for 2013, we took the average of nonseasonally adjusted monthly employment data for the months of January through September of that year.
The only oil and gas activity that was not available under the CES database was drilling. To calculate drilling employment data, we used the QCEW database and found the average annual employment data for 2007 through 2012. For 2013, the only employment information available for drilling was the first-quarter—January through March—average, which is what we used.
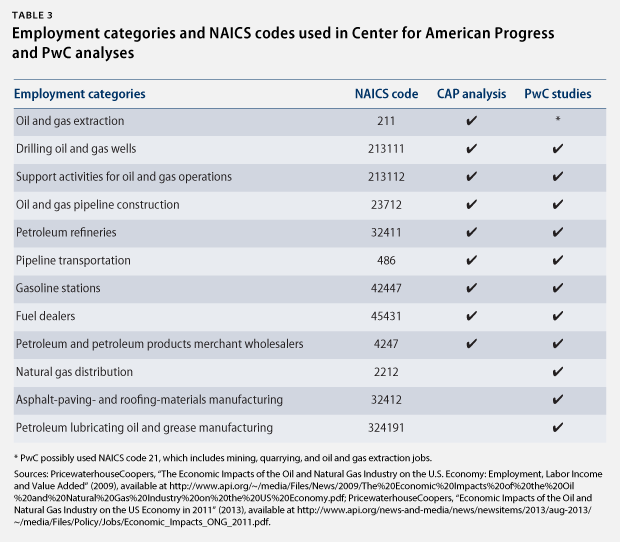
The PwC studies included the following activities under direct oil and gas industry employment: extraction; drilling; operations support; pipeline construction; petroleum refineries; gas stations; pipeline transportation; fuel dealers; petroleum and petroleum products merchant wholesalers; natural gas distribution, both public and private; asphalt-paving- and roofing-materials manufacturing; and petroleum lubricating oil and grease manufacturing.
Table 3 includes a list of the employment categories used in our analysis and the PwC studies; the corresponding North American Industry Classification System, or NAICS, code for each category; and whether the category was used in our analysis or in PwC’s studies.
To gather U.S. employment figures for BP and Shell, we accessed their annual reports, which include their U.S. job counts. ExxonMobil discloses its U.S. job totals in its yearly “Corporate Citizenship Reports,” while Chevron reports its U.S. employment figures in its annual 10-K Securities and Exchange Commission filings.
Mari Hernandez is a Research Associate on the Energy team at the Center for American Progress. She would like to thank the Center’s Daniel J. Weiss and Michael Madowitz for their contributions.