For years, researchers have highlighted the vast inequities that persist in the country’s K-12 education system with students of color disproportionately enrolled in public schools that are underfunded,1 understaffed, and thus more likely to underperform when compared with schools attended by their white peers.2 What has received less attention is the fact that these inequitable patterns do not end when a student graduates from high school but persist through postsecondary education.
These inequitable patterns in postsecondary education take two main forms: gaps in education spending at public colleges, which tend to disadvantage students of color who are concentrated at lower-resourced institutions, and low statewide education spending levels, which affect all public college students.
A new analysis by the Center for American Progress looking at education spending at public two- and four-year colleges shows that the amount spent per student of color—defined here as black and Latino students—is more than $1,000 less per year than what is spent on their white counterparts. This disparity in spending can mean students of color do not receive the same supports as other students in a variety of crucial dimensions, including opportunities to work with advisers and tutors,3 as well as access to mental health services.4
Those differences in expenditures add up. Nationally, as a result of these spending gaps, public colleges spend approximately $5 billion less educating students of color in one year than they do educating white students.
These higher education spending gaps are a function of two key factors. First, as a result of direct policy choices, most states fund their public colleges in a way that provides more money for elite research institutions over less selective community and four-year colleges.5 As a consequence, the resources available to spend on education at community colleges and less selective institutions are often more limited. Second, across the country, there is an inequitable system of access to higher education that disproportionately sends students of color to those very same colleges receiving fewer resources.6 To put it another way, students of color are disproportionately more likely to attend institutions that have lower revenue and government funding per student—meaning that those institutions also spend less on education for each student.
What colleges spend on educating students of color raises two types of concerns about state policy. In some states, public colleges have high levels of spending per student across the board, but some of those same states have sizable enrollment gaps by race. For example, California public colleges have some of the highest spending levels in the country; the state appropriated more than $33 billion for higher education for the 2018-19 school year, including $150 million for the California Community Colleges’ Guided Pathways program to improve student success.7 But because black and Latino students are overrepresented in the state’s two-year colleges—which are typically less expensive to attend and spend less per student—California as a result has substantial spending gaps related to race. The upshot is that black and Latino college students in California receive more than $2 billion less a year in educational spending than do their white peers, who are more likely to attend four-year public institutions.
The other concern, by contrast, is that in some states, public colleges may not have substantial spending gaps by race, but the absolute total amount of money spent educating students of color is substantially lower than the national average. Louisiana, for example, does not have a major gap in spending across different racial or ethnic groups. However, while the average spending per student of color in the United States is around $12,900 a year, Louisiana spends just $9,100 annually—a level that is 34 percent below national figures. The result is that while Louisiana may not disadvantage students of color compared with their white peers in the state, the low overall spending leaves these students behind compared with other states.
Both spending gaps and overall spending levels matter, because research shows that the amount spent educating students can affect their success. A recent study found that a 10 percent increase in total college spending can generate an additional 55 bachelor’s degrees per year at a typical four-year university.8 A decrease in spending, on the other hand, has been shown to exacerbate capacity constraints and negatively affect degree completion at already overcrowded institutions, such as community colleges.9
Though spending more cannot solve every problem in higher education, it would be wrong to assume that the higher education system will adequately serve the most vulnerable students—most often students of color—if public colleges continue to spend the least educating them. Vulnerable students need additional supports; therefore, access to fewer resources means these students face added difficulty in completing degree programs. More equitable funding could not only help these students succeed at higher rates but also could make higher education spending more efficient. And though policymakers should absolutely continue efforts to increase enrollment for students of color at more selective colleges and universities, they must also recognize that giving all students a quality education requires equitable spending at community and less selective four-year colleges.
Methods
CAP analyzed college spending and enrollment data from the Integrated Postsecondary Education Data System (IPEDS) to gain a better understanding of what is spent to educate a full-time equivalent (FTE) student enrolled at a public college in each state. CAP used a combination of the fall student enrollment and 12-month enrollment data at the graduate and undergraduate level to generate a figure for 12-month FTE students by race to reveal gaps in spending.
A few details about the data used in this analysis should be kept in mind. First, the analysis assumes that individual institutions spend the same amount of money on each student. Even though some states, such as California, have recently changed their funding formulas to direct more money toward institutions with a higher proportion of low-income students, the assumption is that individual institutions spend the same per student regardless of background. Second, because IPEDS combines undergraduate and graduate institutional spending categories, this brief includes both undergraduate and graduate students in its FTE student counts. Additionally, IPEDS does not release 12-month data on FTE students by race, so CAP calculated an estimate of those figures by assuming the share of students in a given racial/ethnic category attending full time in the fall is the same as the share doing so over 12 months.
These data limitations may have some effect on the overall results. For instance, colleges may spend much more on graduate students in medical programs, biasing institutional spending figures upward. At the same time, students of color are less likely to enroll in programs that are more expensive, such as engineering; thus, assuming that colleges spend the same on all their students may be conservative. In essence, the assumptions that colleges spend the same per student underestimates spending gaps due to the fact the majority of students of color are enrolled in less expensive academic programs. A more detailed account of the methodology used for this brief can be found in the Appendix.
Findings
CAP’s data analysis yielded four major findings related to public college spending and race:
- Students of color disproportionately go to schools that spend less on them.
- Because of this disproportionate enrollment, public colleges in 75 percent of states spent more, on average, to educate a white student than either a black or Latino student in the 2015-16 academic year.
- Public colleges in two states stood out for having small spending gaps by race but especially low overall spending on students of color.
- If public colleges spend the same on a student of color as they do on a white student, billions of dollars more would be spent to educate students of color each year.
Students of color are overrepresented at schools that spend less on them
Compared with white students, more students of color are enrolled in public two-year colleges or less selective public four-year colleges across the United States.10 In the fall of 2015, more than 55 percent of Latino students and 48 percent of black students were enrolled in a public two-year college, compared with only 39 percent of white students.11
Students of color are vastly underrepresented at public four-year institutions—even in some of the most diverse states. In Texas, for example, 57 percent of black students attended a two-year institution, compared with 48 percent of white students. Enrollment gaps in California are even larger. In 2015, more than three-quarters of black students attending a public college were enrolled in a two-year institution compared with 63 percent of white students.
Many of the factors that cause these gaps in enrollment are linked to the barriers students of color face throughout their lifetime. As an example, students of color are more likely to attend underfunded K-12 schools that lack the resources to adequately prepare students for higher education.12 Additionally, in making admissions decisions, many colleges and universities look favorably on certain variables such as participation in Advanced Placement (AP) courses and after-school activities—factors that work against students who attend under-resourced public schools.13 As a result, students of color are likely to fare worse than their white peers on so-called indicators of success that colleges evaluate for admission.14
Students of color are also more likely to come from families who have low amounts of wealth,15 making it harder for them to afford the higher price tags of more selective colleges. Consequently, these students look for options that provide them with lower tuition costs, that are commuter friendly, and that provide flexibility to work part time. All these factors and more influence a student’s decision whether to attend college and, if so, increase the likelihood of beginning their college career at a less expensive two-year institution that will spend less to educate them.
These differences in enrollment by college type translate to students of color receiving less access to resources. Nationally, at a public four-year college, average annual spending per FTE student on education and related services is $16,600, compared with $9,200 at public two-year college—a 45 percent difference in spending. The differences in spending between two- and four-year institutions is no surprise given the disparity in how they are funded.
Research has shown that direct public funding for public four-year research universities is twice that of two-year community colleges.16 Unfortunately, these gaps appear to be widening over time. From 2001 to 2011, total funding at public four-year universities increased by $2,700, while funding at public community colleges actually declined by nearly $1,000.17 As a result, two-year community colleges have significantly less funding to educate their students.
These spending differences are often justified by noting that four-year colleges and universities have different costs than two-year colleges. For example, four-year colleges typically require more funding for research and educate more upper- versus lower-division students, both of which lead to higher education expenses.18 But such claims ignore the fact that educating students from disadvantaged backgrounds is costly, especially if done well. Community colleges enroll students, such as part-time or first-generation students, who often require additional resources such as remediation or increased advising and mentorship to stay enrolled and complete a degree.19
But even if two- and four-year institutions have different funding needs, the existing funding and consequent spending gaps are problematic because of the negative results they produce. Only 38 percent of community college students earn a credential—either at the institution where they started or at a different institution—within six years of enrollment.20 By comparison, more than half—59 percent—of students who start at a four-year institution graduate within the same time frame.21 Clearly, more investments are needed to improve completion rates across the board.
Despite two- and four-year colleges and universities having different funding needs, the gap in spending for these types of institutions should not be as wide as it is today. Again, while spending alone can’t fix every issue in higher education, research shows that increased spending is directly connected to more students earning college degrees—and lower levels of spending results in fewer graduates.22 Even though other factors—such as the need to enroll part time23 or restrictive child care costs24—affect student outcomes, inequitable gaps in spending mean there are fewer resources to support those students most at risk of not completing. Simply put, students enrolled at community colleges need more spent on them to succeed, not less.
Most public colleges spend less to educate students of color
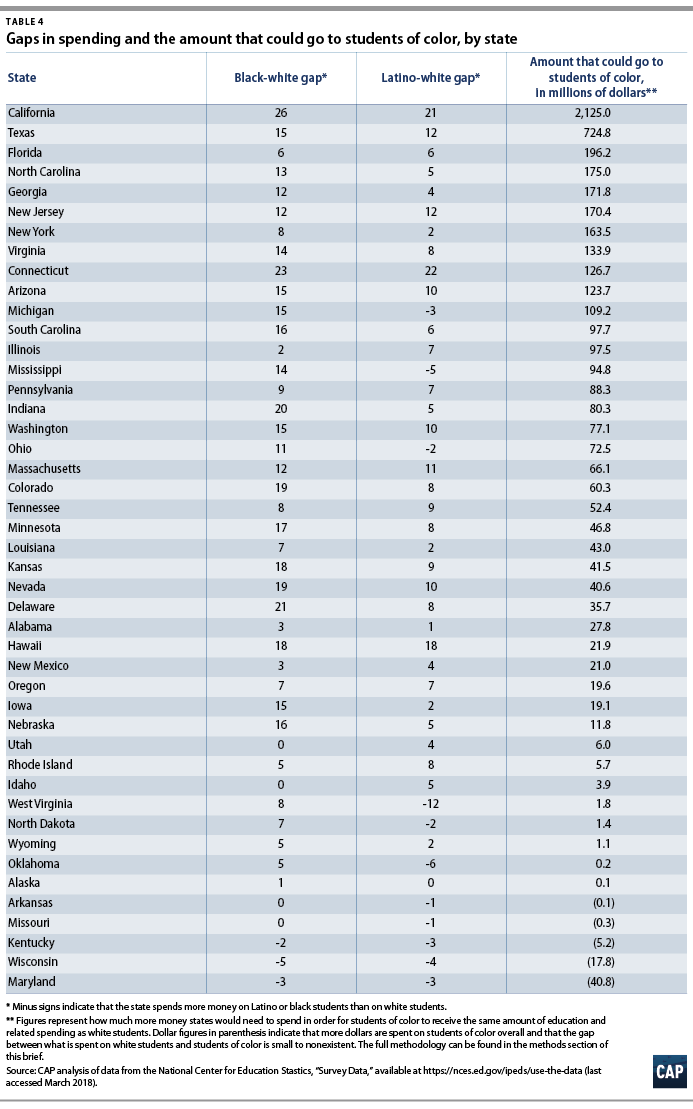
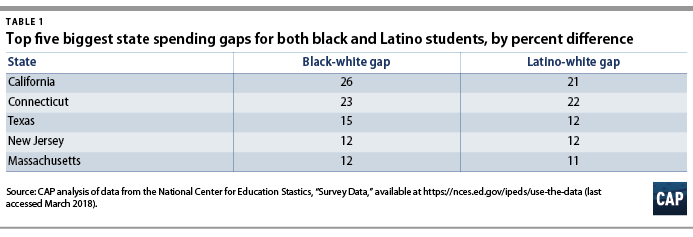
When students of color are predominately enrolled in public institutions of higher education with lower levels of educational spending, the resulting outcome is that fewer resources are devoted to their education. More than 90 percent of black and Latino students enrolled in public colleges are in a state that spends less on them than it does on white students. In total, public colleges in 75 percent, or 34, of the states analyzed spent more to educate a white student than a black or Latino student. (see Table 1)
Spending gaps by race are present in states with both high and low levels of overall spending for public higher education. California, for example, is a leader in higher education in many ways. The governor and California Legislature have committed to making one year of community college free for some students.25 The state has also increased funding for public institutions in its 2017-18 budget.26 However, due to substantial gaps in the types of institutions its students attend, California still has one of the largest racial spending gaps. In 2015, California spent 26 percent more to educate a white student attending college than it did to educate a black college student—a $3,000 difference per student. The difference between what California spent to educate a white student in comparison to a Latino student is also large– a 21 percent gap, or $2,622.
Public colleges in two other states—New Jersey and Massachusetts—also stand out for enrollment gaps by race and therefore, large spending gaps that disadvantage both black and Latino students. In New Jersey, the difference in spending to educate white students and students of color is approximately 12 percent, or more than $1,600 a year. Massachusetts is not far behind: The annual difference in spending on white students and students of color at public colleges is more than $1,500 per student. (see Table 2)
Overall spending is low in some states
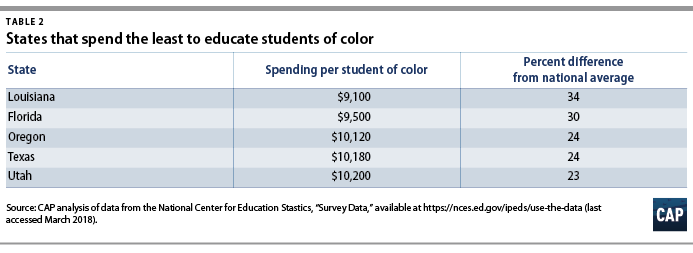
In a number of states, public colleges may not have substantial gaps by race, but their spending levels are markedly low across the board.27 For example, Louisiana public colleges spent just $9,100 per student of color and $9,600 per white student. Both numbers are woefully low. If Louisiana public colleges raised their spending up to the national average for students of color—$12,900 per student a year—more than $264 million more would be spent to educate students of color in the state. Similarly, if Florida’s public colleges raised their spending per student of color to the national average, then $1 billion more would be spent to educate their students of color each year.
Gaps are largest between black and white students
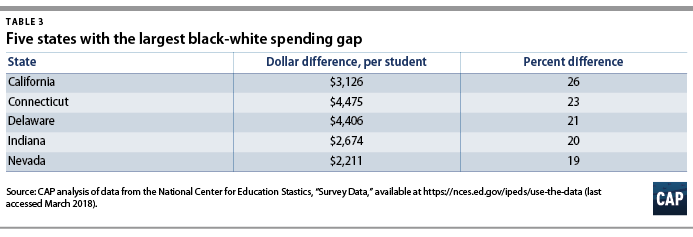
For several states, the gaps in spending between white and Latino students are moderate, while the gaps in spending between white and black students are huge, as shown in Table 3. In more than half, or 23, of states analyzed, the difference in spending by public colleges to educate a white student in comparison to a black student is more than 10 percent. Along with the difference in California, both Connecticut and Indiana have gaps in spending of around 20 percent to educate a white college student in comparison to a black college student.
These gaps in spending are significant, and closing them could mean better outcomes for students, especially students of color. Consider the Accelerated Study in Associate Programs (ASAP) at the City University of New York (CUNY): The program nearly doubled graduation rates of low-income students by offering them a host of services, from advising to public transportation, at an additional cost of $3,900 per student each year.28 Many of the states in Table 3 have public colleges with spending gaps nearly equivalent to the cost of CUNY’s ASAP program.
Billions of dollars more should be spent each year to educate a student of color
Gaps in the amount spent per student add up to billions of dollars in spending differences per year. Overall, if public colleges across that nation equalized their spending per student across racial and ethnic groups, approximately $5 billion more a year would be spent to educate students of color.
Spending gaps within individual states can be substantial. In Texas, for example, equal spending there would result in upwards of $720 million more being spent per year educating college students of color. Eliminating spending gaps in New Jersey, Georgia, and North Carolina would result in each state spending more than an additional $170 million educating students of color each year.
This vision of spending fairness is not entirely theoretical. There is one state that has both a small enrollment gap and more equitable spending. Maryland is the only state where more than 20 percent of public college students are students of color and that does not have a spending gap disfavoring black and Latino students. In 2015, Maryland spent about 3 percent more to educate students of color than white students, or $14,244 and $13,800, respectively. This is in large part due to the state’s unusually small enrollment gaps. Fifty-four percent of Latino students and 57 percent of black students are enrolled in a public four-year college. By comparison, 59 percent of white students are also enrolled in a public four-year institution.
It is difficult to point to one specific policy solution that leads to the state’s positive results, but there are a few factors that have contributed to better outcomes for its students. Maryland has four public historically black colleges and universities (HBCUs) which strengthen the communities around them and provide economic and social opportunities for the students they enroll.29 In addition, the completion rates for black and Latino students in the state exceed the national average for those demographic groups.30
A full table with all the states included in this brief’s analysis can be found in Appendix B.
Conclusion
This analysis joins a host of other studies providing further proof that the negative effects of racial inequities in primary and secondary education persist long after the end of high school. As a consequence, people of color have historically been and continue to be shut out of the American dream.31 People of color earn less,32 accumulate less wealth,33 are more burdened by student debt,34 and are less likely to own a home, to name just a few of the economic—not to mention the social—challenges they face.35
Higher education, however, can be a powerful tool to start addressing many of these issues. While learning beyond high school cannot alone solve issues of employment discrimination or wealth accumulation, closing gaps in educational spending can at least ensure that all students attend public institutions that have the resources to afford them a high-quality education. To accomplish this goal, states and the federal government need to be intentional by making larger investments in those colleges that typically have fewer resources to spend on education—public two-year institutions, as well as HBCUs, minority-serving institutions, and other non-flagship public colleges.
Moreover, it is imperative that states, institutions, and policymakers work together to improve the current system of college admissions and access to ensure the system does not sort students into institutions based on factors that are beyond their control.
Until the doors of opportunity are open to everyone, inequity will persist, and students of color will continue to be shortchanged at every level.
To learn more about or replicate our findings, you can find our detailed Stata code here.
Sara Garcia is a policy analyst for Postsecondary Education at the Center for American Progress.
Appendix A: Methodology
Estimates for the spending analysis presented in this brief used data from IPEDS, administered by the U.S. Department of Education. Institutions report statistics on enrollment, finance, completion rates, and other information. The data presented in this brief are representative of public colleges only. Private colleges were not included for the purposes of this brief. This analysis also excludes any state where students of color comprised 5 percent or less of the enrollment in public colleges. This resulted in the exclusion of five states: South Dakota, Montana, New Hampshire, Vermont, and Maine. The District of Columbia was also excluded due to the absence of multiple public colleges in the city.
Variables
The author pulled three sets of variables from the IPEDS data center. In order to calculate education and related expenditures per FTE student, CAP followed guidelines set forth by the Delta Cost Project.36 For each institution for the 2015-16 academic year, the author used that guidance and pulled from IPEDS the following expenditures variables: instruction, research, public service, academic support, student services, institutional support, and operation maintenance. In order to calculate the FTE student count, the analyst used 2015 fall enrollment by race data, broken down by full- and part-time status, as well as 12-month headcount.
Enrollment calculations
Currently, IPEDS does not release 12-month data—the total number of students enrolled during a full 12-month span—on FTE enrollment by race. Therefore, in order to calculate the FTE student count variable used for the analysis, CAP took the breakdown of full- and part-time students in each racial group for the fall of 2015 and applied those same proportions to the 12-month headcount. The analyst then converted the number of part-time students to a FTE student count using a conversion factor provided by the National Center for Education Statistics.37 This calculation was then replicated for each undergraduate and graduate racial category.
The final FTE student count was calculated by adding together the undergraduate and graduate 12-month full-time student count and undergraduate and graduate 12-month part-time student count for each racial category.
Spending calculations
Because some institutions report financial information that covers multiple campuses, this analysis grouped the related branch campus of each public parent-university system together, and the dollars were allocated to each child campus using the allocation factor reported to IPEDS.38
The Delta Cost Project’s formula for education and related expenditures was then used to estimate the education and related expenditures at each institution.39 This category includes instruction, student services, academic support, institutional support, and operation/maintenance dollars. The formula also included a separate “education share variable,” which is the portion of instruction and student service dollars of the combined total of instruction, student services, research, and public service dollars. The research dollars used for the education share variable do not affect the spending figure directly, rather just what share of the education share variable to apply toward the spending figure equation. This proportion was included in the calculation of education and related expenses.
CAP then took the total expenditures figure and divided it by the total FTE student figure to generate spending per student for each institution. It is assumed that the spending-per-student amount was the same for each racial category. In other words, if it is estimated that a school spent $10,000 per student, then it was assumed the average white student at that school had $10,000 spent on them, as did the average black and Latino student.
Additionally, the spending figures used for this brief are not adjusted for cost of living. Cost-of-living estimates vary greatly within states, and the author decided that their inclusion would have made the analysis more complex than necessary.
The analysis aggregated institutional data to the state level by calculating the average spending per student of a given racial or ethnic category, weighted by the number of students in that group at a given school. The following example illustrates how this works:
A state has two institutions: College A and College B. College A spends $10,000 per student and has 10 black students. College B spends $5,000 per student and has 100 black students. Thus, the total number of black students in the state is 110. College A has 10 black students. Divide that by the total for the state—110—and you get a ratio of .09. Then multiply that by the spending per FTE student at College A—$10,000—to get $909.09. This is the weighted approximate amount spent per black student at College A. Repeat these steps for College B to get $4,545 spent per black student at College B. Then add up the amount spent per black student at each college in the state—for example, College A plus College B—and the spending per black student in the state then comes out to $5,454.
All data for this brief are publicly available at the sources listed in the Endnotes.
Appendix B: Full state table