After examining economic data from the past few months, there is no doubt that Congress needs to pay closer attention to the economy rather than play political games with the federal government’s finances. A radical conservative minority in the House forced a government shutdown for the first 16 days in October and created tremendous uncertainty in financial markets by barely averting what would have been an unprecedented default on government debt. These manufactured crises cost the economy desperately needed jobs, led to rising interest rates, slowed the housing-market recovery, and dampened business investment.
The economic recovery that started in June 2009 was already modest before the government shutdown, and House leaders’ political gamesmanship has slowed progress even further. High unemployment and low wage growth have marked the labor market for more than four years. Economic insecurity has worsened from cutbacks in employer-sponsored retirement and health insurance benefits and sharply reduced homeownership rates. America’s families are hurting and need their elected officials to pay attention to their economic struggles.
The good news is that Congress will have a second chance to realign the federal government’s finances with people’s priorities. The deal that reopened the government funds federal operations through January 15, 2014, and lifts the debt ceiling—the amount the federal government can borrow without congressional approval—through February 2014. Congressional leaders need to broker deals on the federal budget and the debt ceiling in the next three months to avoid repeating this October’s disaster. If they focus on economic growth and job creation, these deals could strengthen the economy.
To achieve this, Congress must strike a longer-term deal that creates economic certainty and invests in businesses and households. That includes infrastructure investments, more spending on education, and better workforce training, wrapped up in a budget that balances slower spending growth with enhanced revenues, which can start to strengthen economic security for millions of families. Here’s a look at the problems the congressional deal should address:
1. The economy continues to grow slowly. Gross domestic product, or GDP, increased in the second quarter of 2013 at an inflation-adjusted annual rate of 2.5 percent. Domestic consumption increased by an annual rate of 1.8 percent, housing spending substantially grew by 12.5 percent, and business investment accelerated by 4.7 percent. Exports increased by 8 percent in the first quarter, but government spending shrank again by 0.4 percent, slowing overall growth.
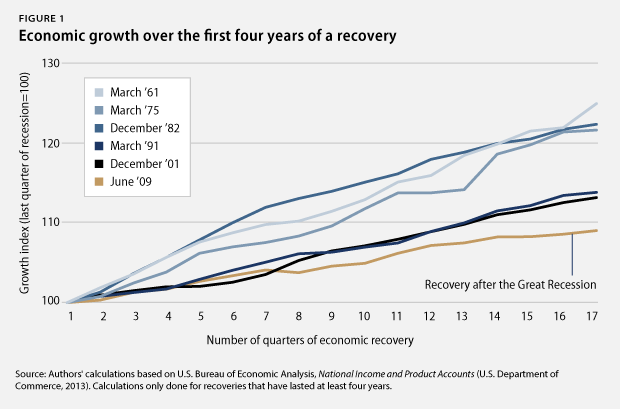
The U.S. economy was 9.2 percent larger in June 2013 than in June 2009 in inflation-adjusted terms, when the recovery officially started. On average, however, the economy has expanded by 19.1 percent—more than twice as fast—during the first four years of a recovery, in recoveries that lasted at least four years. Fiscal austerity abroad and at home is hurting economic growth. Policy solutions should therefore aim to ease the strain of U.S. fiscal austerity on the economy and replace across-the-board spending cuts with a fiscal policy approach that can enhance rather than slow economic growth, while also reducing long-term deficits.
2. The moderate labor-market recovery continues in its fourth year. There were 5.7 million more jobs in September 2013 than in June 2009. The private sector added 6.4 million jobs during this period. The loss of more than 610,000 state and local government jobs explains the difference between the net gain of all jobs and the private-sector gain in this period. Budget cuts reduced the number of teachers, bus drivers, firefighters, and police officers, among others. Job creation should be a top policy priority, since private-sector job growth is still too weak to quickly overcome other job losses and rapidly lower the unemployment rate. A reorientation of tax and spending policies to strengthen economic growth, rather than a blind obsession with deficit reduction at all costs, could create millions of jobs that America’s middle class desperately needs.
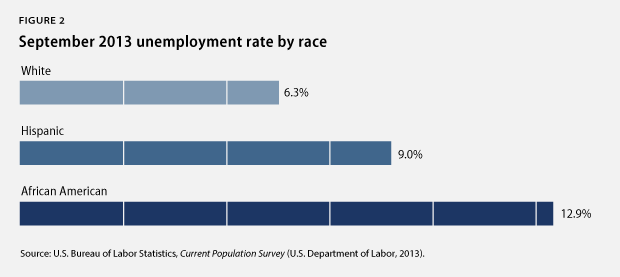
3. Some communities continue to struggle disproportionately from unemployment. The unemployment rate stood at 7.2 percent in September 2013. The African American unemployment rate was 12.9 percent in September 2013, the Hispanic unemployment rate was 9 percent, and the white unemployment rate was 6.3 percent. Meanwhile, youth unemployment stood at 21.4 percent. The unemployment rate for people without a high school diploma ticked down to 10.3 percent, compared to 7.6 percent for those with a high school degree, 6 percent for those with some college education, and 3.7 percent for those with a college degree. Population groups with higher unemployment rates have struggled disproportionately more amid the weak labor market than white workers, older workers, and workers with more education. Policymakers should heed the recommendations in All-In Nation—a new book from the Center for American Progress and PolicyLink—on building a strong and diverse workforce that draws from all communities.
4. The rich continue to pull away from most Americans. Incomes of households in the 95th percentile—those with incomes of $191,000 in 2012, the most recent year for which data are available—were more than nine times the incomes of households in the 20th percentile, whose incomes were $20,599. This is the largest gap between the top 5 percent and the bottom 20 percent of households since the U.S. Census Bureau started keeping records in 1967. Median inflation-adjusted household income stood at $51,017 in 2012, its lowest level in inflation-adjusted dollars since 1995. And the poverty rate remains high, at 15 percent in 2012, as the economic slump continues to take a massive toll on the most vulnerable citizens.
5. Poverty stays high. The poverty rate remained flat at 15 percent in 2012, the most recent year for which data are available. The African American poverty rate was 27.2 percent, the Hispanic poverty rate was 25.6 percent, and the white poverty rate was 9.7 percent. The poverty rate for children under the age of 18 stood at 21.8 percent. More than one-third of African American children—37.9 percent—lived in poverty in 2012, compared to 33.8 percent of Hispanic children and 12.3 percent of white children. The prolonged economic slump, following an exceptionally weak labor market before the crisis, has taken a massive toll on our country’s most vulnerable citizens.
6. Employer-sponsored benefits disappear. The share of people with employer-sponsored health insurance dropped from 59.8 percent in 2007 to 54.9 percent in 2012, the most recent year for which data are available. The share of private-sector workers who participated in a retirement plan at work fell to 39.2 percent in 2011, down from 42 percent in 2007. Families now have less economic security than in the past due to fewer employment-based benefits, which requires that they have more private savings to make up the difference.
7. Family wealth losses still linger. In June 2013, total family wealth was down $1.5 trillion in 2013 dollars from March 2007, its previous peak. On average, homeowners own only 49.8 percent of their homes—compared to the long-term average of 61 percent before the Great Recession—with the rest owed to banks. Homeowners’ massive debt slows household-spending growth, as households still have little collateral for banks to loosen their lending standards and households spend less than they otherwise would on new homes and other big-ticket items.
8. Household debt is still high. Household debt equaled 104.3 percent of after-tax income in June 2013, down from a peak of 129.5 percent in December 2007. Household debt has hovered around 105 percent of after-tax income for one year now. That is, the unprecedented deleveraging—debt decline—trend that marked the Great Recession has stopped. A return to debt growth outpacing income growth, which was the case prior to the start of the Great Recession in 2007, from already-high debt levels could eventually slow economic growth again. This would be especially true if interest rates also rise from historically low levels due to a change in the Federal Reserve’s policies and crowd out household spending on other items.
9. The housing market continues to recover from historic lows. New home sales amounted to an annual rate of 421,000 in August 2013—a 12.6 percent increase from the 374,000 homes sold in August 2012 but well below the historical average of 698,000 homes sold before the Great Recession. The median new-home price in August 2013 held steady from one year earlier. Existing-home sales were up by 10.7 percent in September 2013 from one year earlier, and the median price for existing homes was up by 11.7 percent during the same period. Home sales have to go a lot further, given that homeownership in the United States stood at 65 percent in the second quarter of 2013, down from 68.2 percent before the recession. The current homeownership rates are similar to those recorded in 1995, well before the most recent housing bubble started. Though the housing-market recovery started later than the wider economic recovery—and started out at a record low—lately the housing market has been growing rapidly and contributing a much-needed boost to economic progress. As such, there is still plenty of room for the housing market to provide more stimulation to the economy more broadly. The fledgling housing recovery could gain further strength if policymakers support economic growth and job creation at the same time.
10. Corporate profits stay high near pre-crisis peaks. Inflation-adjusted corporate profits were 84.5 percent larger in June 2013 than in June 2009, when the economic recovery started. The after-tax corporate-profit rate—profits to total assets—stood at 3.2 percent in June 2013, nearing the previous peak after-tax profit rate of 3.3 percent that occurred prior to the Great Recession. But business investment remains low at the same time, suggesting that businesses are hoarding cash and using their resources for executive compensation and overseas acquisitions instead.
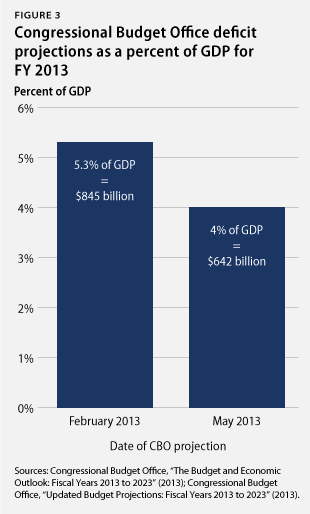
11. The outlook for budget deficits improves. The nonpartisan Congressional Budget Office, or CBO, estimated in May 2013 that the federal government will have a deficit—the difference between taxes and spending—of 4 percent of GDP for fiscal year 2013, which runs from October 1, 2012, to September 30, 2013. This deficit projection is down from 7 percent in fiscal year, or FY, 2012. This projected deficit for FY 2013 is better than what CBO predicted in February 2013, when it estimated a deficit of 5.3 percent of GDP for FY 2013. This improvement follows larger-than-expected tax collections, an improving economy, and slower health care inflation, among other factors. The estimated deficit for FY 2013 is much smaller than it was in previous years due to a number of measures that policymakers have already taken to slow spending growth and raise a little more revenue than was expected just last year. The improving fiscal outlook generates breathing room for policymakers to focus their attention on long-term growth and job creation in addition to long-term deficit reduction.
Christian E. Weller is a Senior Fellow at the Center for American Progress and a professor in the Department of Public Policy and Public Affairs at the McCormack Graduate School of Policy and Global Studies at the University of Massachusetts Boston. Sam Ungar is a Research Assistant at the Center.