Introduction and summary
By some measures, educational attainment is the highest it has ever been. National high school graduation rates have risen every year since they were first collected in the 2010-11 school year by the U.S. Department of Education.
Yet, ensuring that all students complete high school remains an elusive goal. Approximately 1 million high school students each year fail to earn a diploma or its equivalent.1 This number translates to a national school dropout rate of 5.9 percent, but for certain subgroups of students, specifically black and Hispanic students, it is much higher—6.5 and 9.2 percent, respectively.
Under federal law, high schools with graduation rates that are less than 67 percent or meet other criteria for low performance are subject to intensive improvement strategies. This requirement also applies to what the law defines as “alternative education campuses” (AECs), schools that states have established to serve the unique needs of students who are at risk of dropping out or who have re-engaged in school.
Federal policy allows states to use the same, or different, measures to hold these schools accountable for their performance as other public schools. However, there is a knowledge gap when it comes to understanding how students navigate the alternative school experience and how effectively the federally required school performance measures assess these schools.
Recent analyses show that without meaningful accountability, traditional school districts may push struggling students into low-quality alternative schools.2 The analysis shared in this report suggests that measures used to hold these schools accountable may over-identify failure and under-identify success. School accountability systems better designed to measure the nuances of student experience in these schools would provide critically needed insights.
This paper provides the groundwork to design such measures. The recommendations aim to improve researchers’, practitioners’, and policymakers’ ability to conduct much-needed investigation into the experience of students in alternative schools, while striking a balance between accurate measurement and rigorous expectations. It presents two options for states to consider in developing federal accountability systems for alternative schools.
First, states could forego using metrics in federal law, as these calculations inadequately determine performance for students who are poorly served by traditional schools. This report will demonstrate this inadequacy by looking at the experience of the New York City public schools and proposing metrics that better capture this experience. States interested in developing customized metrics should conduct similar analyses of their student outcome data for alternative schools.
Second, states could use the 67 percent graduation rate metric to identify schools as low-performing, while using recommendations presented in this report—including a graduation rate index, credit accumulation, and attendance—to gauge progress to exit low-performing status.
In this report, the authors review the characteristics of alternative schools on a national level, profile the students who attend them, and outline the legal history of these schools. The report also explores a series of options to more effectively measure the performance of alternative high schools. While meaningful school accountability systems include the examination of a wide array of data and the implementation of supports to ensure continuous improvement in all schools,3 this report focuses exclusively on measuring school progress. Data on school progress is a necessary first step toward designing broader systems of support, improvement, and resource allocation. The proposed school progress metrics fall into three areas: graduation rate; academic proficiency; and school quality and student success. These proposed metrics draw upon efforts in alternative high schools in the New York City Department of Education
The educational progress of students in alternative schools
For more than 20 years, standards-based accountability has been a cornerstone of education policy in the United States. This effort has included setting the same, rigorous academic standards for all students, and holding schools, districts, and states accountable for students meeting those standards. Yet, this has not always had the intended consequences. Data show that some states lowered their proficiency standards in reading and math so that more students could count as proficient under the No Child Left Behind Act.4 The updated law, the Every Student Succeeds Act (ESSA) of 2015, requires that proficiency standards mean that students meeting them do not need remedial education when in college. ESSA’s requirement intends to set the expectation that all students should be prepared for the next step when they receive a high school diploma.
Similarly, for more than 10 years the nation has used a four-year cohort graduation rate for federal accountability purposes, setting the expectation that students should graduate from high school within four years. These consistent expectations for high schools are intended to address inequities in access to a high-quality education and inequities in outcomes for different groups of students. Based on how students progress through school, however, the traditional measures of educational progress do not adequately measure how well alternative education campuses, specifically alternative high schools, are serving their unique population of students.
Traditional student performance measures assume a cohort of students making regular progress—that is to say, students enter high school and four years later they graduate. In between, teachers and tests judge their progress. Most students follow this linear path meeting traditional performance measures along the way and graduating at the end of four years. However, some students fall behind for myriad reasons.
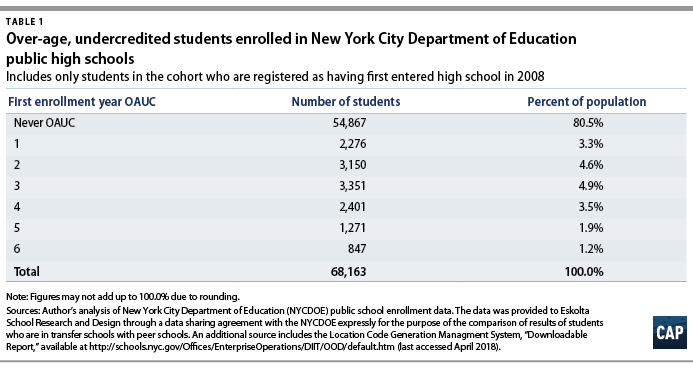
To understand this dynamic more deeply, Eskolta School Research and Design studied seven years of data for nearly 70,000 New York City public school students whose first year of high school was 2008, tracking whether they had graduated by 2014, six years later. In the equivalent of ninth, 10th, and 11th grades, 7 out of 8 of these students made regular progress. However, one-eighth did not, falling two or more years behind within their first three years of high school.5 Of the students who had not fallen behind in their first three years, 88.9 percent graduated by 2014. Of those who did fall behind, however, the chances that they graduated by 2014 were far worse. Most remained in traditional high school settings; of these, just 13.2 percent graduated by 2014, a rate 75.7 percentage points lower than that of students who had not fallen behind. But nearly 2,000 of the students who had fallen behind instead transferred out of traditional high schools and into alternative high schools; of these, 29.9 percent graduated by 2014, more than double the rate of their counterparts in other high schools. Measured against a single statewide standard, this figure appears dismal, but measured against the track record of the students who are entering, it appears outstanding. The reality, however, is that measures like the four-year or six-year graduation rate simply do not do justice to the lived experience of these students.
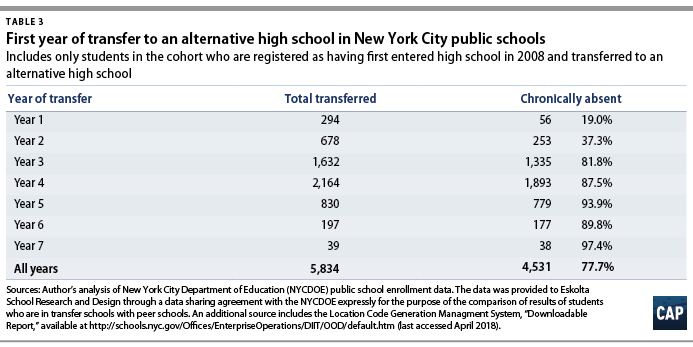
The vast majority of students who transferred from traditional high schools to alternative high schools did so following experiences that disrupted the linear progress assumed by traditional measures of performance—many of which were traumatic and stigmatizing. In the cohort studied in New York City, for example, this disruption in education is reflected in the fact that more than three-quarters (77.7 percent) of the students who transferred to alternative high schools had been chronically absent the year that they transferred.6
"]“Students are struggling with mental health or health issues, students are working full-time or have head of household responsibilities.”
For these students, progress may be more erratic. A child experiences trauma—a violent episode, problems with substance abuse, financial hardship, a family illness, depression—after which school performance suddenly and dramatically falters. Dropping out of school or being held back multiple times can itself be experienced as a traumatic event. Students who fall behind may feel that they no longer belong to an academic community or may doubt their ability to succeed, mindsets that foreshadow poor academic performance.7
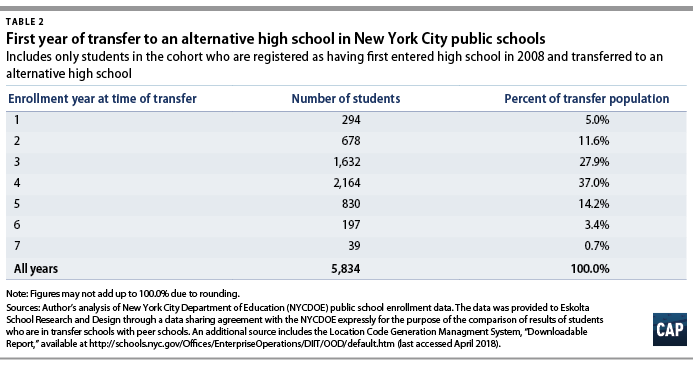
Graduation measures that treat these students as if they are part of a cohort that is proceeding without interruption contradicts their experiences. From a purely statistical standpoint, there is little to no chance that they will graduate in four years. In the cohort studied in New York City, for example, nearly 1 in 5 students (18.3 percent) arrived at an alternative high school after their fourth year of high school. An additional 37.1 percent arrived at an alternative school during their fourth year.8 Including these students in a four-year cohort relegates the schools into which they transfer to a dataset that virtually guarantees a “negative” graduation rate, since calculation of graduation rates counts every student enrolled, even if that student arrived just weeks or months before their graduation date. As this report highlights below, students in alternative schools can achieve positive school completion outcomes that are different than those typically counted by accountability systems.
A national picture of alternative schools
Beginning in 2001 with the No Child Left Behind Act and continuing under ESSA, states could design accountability systems that better measure the unique characteristics of alternative schools. To do so, states must better understand the characteristics of alternative schools and their students.
There is no consensus definition of alternative schools; each state determines its own grade configurations and eligibility criteria.9 This lack of consensus makes it difficult to ascertain how well these schools serve their students.
For example, exactly what counts as an alternative school varies by the data set. The National Center for Education Statistics (NCES) reports demographic and outcome data for alternative schools, defined as, “A public elementary/secondary school that addresses the needs of students that typically cannot be met in a regular school program. The school provides nontraditional education; serves as an adjunct to a regular school; and falls outside the categories of regular, special education, or vocational education.”10 However, since states decide what counts as an alternative school for federal school accountability purposes, there are discrepancies in calculations of how many of these schools exist, how many students they serve, and what outcomes they generate when comparing state and federal data on these schools.
Evidence of the likely discrepancy between definitions used at the district, state, and federal level can be found in the estimates from NCES placing the number of alternative schools at 6,448 in 2005-06, 10,300 in 2007-08, and 6,293 in 2009-10. Here, we will use the 2014-15 school year data from NCES, which identified about 4,548 alternative high schools and 435,088 students enrolled in these schools nationwide, representing almost 17 percent of all public high schools and almost 3 percent of public high school students.11
These national data also indicate that alternative schools are much more likely to experience closure than any other school type. For example, even though alternative schools make up only 6 percent of all schools they make up 23 percent of all school closures.12 Closure may be due to low graduation rate or other factors. In fact, some of the same factors that make aligning alternative high school definitions difficult—their small size and mixed grade level offerings, for example—also make understanding their average graduation rates difficult.
While these data do shed light on the characteristics of alternative high schools and students, it is critical that stakeholders reach a more aligned definition. Without such alignment, there will never be an accurate national understanding of how well these schools are serving their students.
Federal policy allowing for innovation in measuring alternative schools
The Every Student Succeeds Act requires that all public schools be held accountable for their performance using five types of annual indicators that states must customize. These indicators are to be used for annual school performance identifications and for periodic identification of low-performing schools. ESSA-required indicators for all schools include: academic proficiency; English language proficiency for English learners; and at least one measure of school quality and student success. High schools also use graduation rate as an indicator; elementary and middle schools, meanwhile, use another academic indicator, such as student growth.
In March 2017, the U.S. Department of Education provided a revised template for states to submit their consolidated ESSA state plans. This template gives states the opportunity to describe a distinct methodology for annually identifying school performance for schools for which an accountability determination cannot be made.13 While not explicitly noted in the state plan template, since states must use their annual performance system to also periodically identify low-performing schools, it logically follows that this alternative methodology could be used for both purposes: annual performance determinations and periodic identification of low-performing schools.
Given federal accountability requirements, the limitations in their usefulness to alternative high schools, and the significant flexibility available in holding them accountable, this report proposes a series of indicators that better measure academic attainment, high school completion, and other measures of what federal law calls “school quality and student success.”14 These indicators are based on the experience of alternative high schools in New York City and can be useful for states considering developing a unique system of accountability for alternative high schools.
Pioneering change in New York City
In New York City public schools in recent years, a series of experiments have been underway. In 2006, the school district created a new school progress report card specifically for alternative educational campuses—which New York calls “transfer schools”—and supported a wave of openings of these schools.
The district’s transfer schools were originally defined as those serving high school students who enroll after having previously been enrolled in another high school. The definition has since expanded to include some schools that enroll ninth graders who enter high school already two or more years behind. While students enroll in these alternative high schools for myriad reasons, and such schools have been options in New York for decades, recent attention has been on the students in the district’s transfer schools who are over-age and under-credited, meaning the number of high school credits they have earned given their age is two or more years behind what it should be.
"]“Students at transfer schools are often called at-risk because of a system that treats them unequally.”
In the past decade, the district has gradually revised and refined accountability metrics that treat high school graduation and academic growth differently for its transfer schools than for its other high schools. Over a similar time, the nonprofit New York Performance Standards Consortium, a coalition of schools across the state, brought together 36 New York City schools, eight of which are transfer schools, to pioneer project-based assessment tasks (PBATs) to measure student academic proficiency.
These efforts are occurring alongside real and meaningful change for students and schools. Currently, the district has more than 50 transfer schools enrolling nearly 15,000 students, a dramatic increase in both number and enrollment over the last 15 years. Alongside the proliferation of transfer schools, the city has seen improvements in its state-reported graduation rates. From 2011 to 2016, when national graduation rates rose a healthy 4 percentage points, in New York City graduation rates outpaced these significantly, with four-year graduation rates rising 7.5 percentage points (from 65.5 percent to 73.0 percent) and six-year rates 5.7 percentage points (from 70.9 percent to 76.6 percent).15
While graduation rates among transfer schools are lower than that of traditional high schools, data suggest that students attending transfer schools would, in the absence of these schools, have graduated at rates at least 50 percent lower than they did.16 As referenced earlier, reviewing data on nearly 9,000 students who fell two or more years behind in their first three years in one cohort of New York City public high school students, Eskolta found a graduation rate of 13.2 percent for those who remained on register at a traditional high school, compared to a graduation rate of 29.9 percent for those who instead transferred to an alternative high school.17 A study by Metis Associates for Good Shepherd Services showed that students who attend transfer schools using a model that intentionally incorporates youth development and counseling practices to reintegrate students into the high school setting are 12.6 percent more likely to graduate than students with similar demographic and academic characteristics.18
Rethinking metrics to create more innovative and accurate systems
Do states have performance indicators that are appropriate to alternative high schools? Effective indicators should relate to key student outcomes, meaningfully differentiate among elements that lead to those outcomes, and incentivize positive action at the school and district level.19 The indicators recommended in this report draw upon the pioneering work of New York City to do that. They address four aspects of measures to inform policymakers’ understanding of the alternative high school population:
- How will measures be calculated such that schools and districts are focused on the right outcomes? For students whose success in conventional high schools was hard to discern, cultivating success in new environments requires care and attention from the adults who make these calculations.
- Which students’ data will be attributed to which schools? When students have struggled at one school, then transfer to an alternative education campus, decisions of data attribution become complicated. At what point are students attributed to a school?
- Which students are considered part of the same cohort? This decision enables schools to differentiate among groups of students and, when organized meaningfully, is a better incentive to action. In conventional high schools, this is simply defined as the students who entered ninth grade at the same time. In schools that accept the clear majority of their students after ninth grade, defining a cohort becomes more complicated.
- Against what benchmark will schools’ results be compared? When a high school mostly enrolls students with predicted outcomes that are far weaker than average, that school is what statisticians call a “biased” sample. How can these outcomes be differentiated to consider the characteristics of the sample of students that are in an alternative high school?
This report focuses on presenting new measures for graduation rate, academic proficiency, and what ESSA calls “school quality and student success” generally addressing the four aspects detailed above.
Graduation index
Because of the students that they enroll, alternative high schools are chronically identified as underperforming due to low four-year graduation rates. In 2017, for example, of the 51 New York City transfer schools with sufficient data to report four-year graduation rates, only two schools would have met the 67 percent graduation rate needed to avoid the underperforming designation under ESSA.20 Put simply, a four-year or even extended-year cohort rate would over-identify these schools as low graduation rate schools. To better identify alternative high schools’ rates of school completion and to group students in a way that brings meaningful differentiation and incentivizes action, states should create an alternative high school graduation index that contains the following elements:
- Calculation. Include all regular high school diploma graduates, not only those who graduate within four, five, or six years. Recognize other positive school completion outcomes, verified by documentation from the school leader, on a case-by-case basis.
- Attribution. Attribute student data to schools after an agreed period of continuous enrollment determined by the state.
- Cohort. Use a single-year graduation with a regular high school diploma cohort based on exit or targeted exit dates.
- Comparison. Consider establishing a peer comparison benchmark or subgroups against which graduation outcomes above are compared to measure outcomes.
Calculation: Inclusion of all graduations and identified school completion outcomes
Federal guidelines generally emphasize four-year graduation rates. New York’s City’s “transfer graduation rate,” created specifically for its accountability reports for transfer schools, instead includes all students who earn high school diplomas in a given year, regardless of how many years they have attended high school. This approach has the advantage of counting diploma-earning graduates who would not be counted in a traditional four-year graduation cohort. In New York City in 2017, for example, 1,852 students who earned their diplomas after more than four years were counted in the transfer school graduation rate, making the transfer school graduation rate of 51 percent slightly more than double the 24 percent four-year graduation rate for transfer schools.21
In 2012, New York City added to its progress reports for all high schools a postsecondary success metric that credits schools not only for graduates, but also for students’ enrollment in two- or four-year colleges, vocational programs, or public service programs. Nearly all of these data come from the National Student Clearinghouse or from the City University of New York. To supplement these data for students not included in these sources, principals can attest to other postsecondary outcomes, provided that they retain documentation on file that is periodically audited by the district. The supplementary information is a step toward generating goodwill and investment from principals of the schools being held accountable, in that it takes a broad view of success, an important element of the success of an accountability system.
Attribution: Assigning students to schools
Which school is held accountable for a student’s data once he or she exits school? For example, if a student drops out of one high school after three years, then enrolls in an alternative high school and drops out after three days, which school is held accountable for that subsequent dropout? If accountability immediately transfers with the student, the alternative high school in this example would be held accountable for that student’s second dropout—even though that school had minimal opportunity to influence the student’s growth. On the other hand, if accountability takes too long to transfer, then the student’s first school remains accountable for a student’s subsequent dropout even after it no longer wields influence on that student’s outcomes. States should identify an agreed period of continuous enrollment after which students are attributed to the school.
Cohort: Inclusion of all graduates
Nationally, the graduation cohort is calculated as the percentage of all students who entered ninth grade at the same time and graduated four years later. But conventional cohorts can be confusing for schools such as alternative high schools, where virtually no students enrolled when they were in ninth grade. Indeed, most transfer schools in New York City simply do not use the notion of traditional ninth, 10th, 11th, or 12th grade because these do not differentiate among transfer high school students in a way that is meaningful. Furthermore, conventional graduation rates are labeled “four-year” and “six-year” when alternative high schools in fact have far less time than this. In the cohort studied in New York City, as noted earlier, fully 55 percent of students entering their first year at transfer high schools were already in their third year or later of high school.22
With a waiver under No Child Left Behind in 2008, New York State adopted a single-year entry cohort for testing measurements in its transfer schools. Instead of focusing on the year that students entered ninth grade, every student who entered the transfer school in a given school year was included in accountability measures three years later. Further analysis by New York City has since highlighted problems with this approach, particularly in that it overlooked the progress of schools that worked with students who were significantly far behind and therefore needed more than three years to recover learning.23 One way of addressing this issue would be to place students in cohorts based on their credit level at the time of enrollment into the school, such that entering students with the same general number of credits needed to reach graduation are placed in the same cohort. For example, all students who enroll with less than one-quarter of the credits needed to graduate high school would be placed in one cohort while those who enroll with one-quarter to one-half the credits needed to graduate would be placed in another cohort with a different targeted graduation year.
A variation on the single-year entry cohort is a single-year exit cohort. All students who exit the school in a given year are counted in this graduation rate. For instance, if 100 students exit an alternative high school in 2017-18, of whom 60 do so with high school diplomas and 40 do not, then the single-year exit graduation rate for the school’s cohort is 60 percent. While this approach has not been utilized in New York City, it has the advantage of connecting to a set of students who were all enrolled in the school in the year for which the school is held accountable and of counting every student, thereby better meeting the test of incentivizing school-level action. A drawback, however, is that data may be skewed by the length of time students are enrolled. For example, consider a school that largely enrolls older students who are very close to graduation, but also serves some who are not as old and remain enrolled for significant time without graduating. This school would experience a relatively high graduation rate using a single-year exit cohort measurement when compared to a school that measures graduation rates using a single-year entry cohort.
Comparison: Peer benchmark
Critically, New York City has innovated in how it establishes the benchmark against which success is measured. The district has developed a matching system in which every individual enrolled student is statistically matched with historical data on 50 similar students. These matches are based on various factors that are known to be strong predictors of success, such as special education status, prior test scores, socio-economic factors, age, and past credit attainment. For instance, a 17-year-old who enters high school with a particular set of characteristics is matched with 50 similar 17-year-olds who attended New York City high schools in the past. Looking at the past data on those 50 similar students, New York City Department of Education officials can see that this sample had a 10 percent graduation rate. These figures are averaged for every student in the school’s cohort to set a dynamic benchmark against which its graduation rate is compared. States may then determine how to count this comparative performance as an accountability indicator.
New York City’s innovative benchmarks recognize the varied challenges in each school and differentiate the accountability indicators for each school based on the characteristics of the students enrolled there. However, such a system is statistically complex, requiring the district to invest heavily in capacity to perform the analysis and to have sufficient sample of tens of thousands of students for a reliable comparison. By comparing current students to past students, this method may also inadvertently reinforce existing inequities and may not set a high enough expectation for the future. We recommend that states that do not already collect such data engage in pilots of three to five years in which data are collected and analyzed and gradually refined with stakeholder and public input before being used for accountability purposes.
"]“If we keep looking at dismal numbers … it doesn’t compel my staff to work harder, it makes us feel worse about what we are doing.”
Comparison groups based on status at entry
For states that find New York’s complex statistical matching system onerous, another option is to create a few subgroups for reporting purposes. Graduation rates should be reported and benchmarked separately for each of the following three distinct subgroups at each alternative high school:
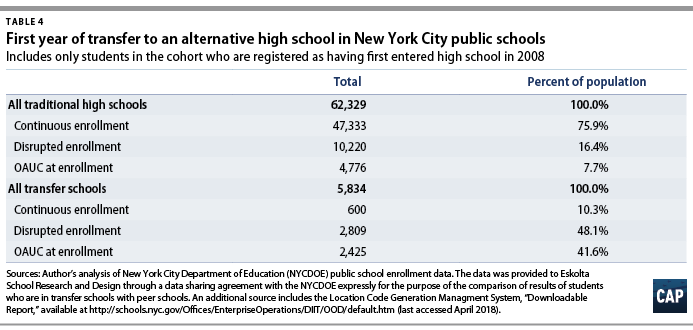
- A continuous enrollment subgroup, which consists of all students who were consistently enrolled in the same high school. In the sample of students studied in New York City, three-quarters (75.9 percent) of students across all high schools were in the continuous high school subgroup, as compared to 1 in 10 (10.3 percent) in its alternative high schools.
- A disrupted enrollment subgroup, which consists of all students who enroll in a high school for the first time having already attended another high school previously, but whose credits keep them on track to graduate on time. This group comprised less than one-fifth (16.4 percent) of students in New York’s high schools, and nearly half (48.1 percent) in its alternative high schools.
- An overage at enrollment subgroup, which consists of all students who, upon their first day of enrollment, were two or more years behind in their accumulation of high school credits based on their age (for example, a student who enrolled in a high school at age 17 with only 3 credits). This group comprised 1 in 13 students (7.7 percent) across New York’s high schools, and about two-fifths (41.6 percent) in its alternative high schools.24
Academic proficiency
For students who have struggled academically and faced repeated failing scores, academic proficiency measures that rely solely on standardized tests to assess their knowledge and skills may reinforce a sense of academic failure. At the same time, standardized tests are required by federal law at the high school level once in English and once in math, in large part because they can provide information intended to promote equity in school systems.25 Further complicating assessment of these students is the fact that students may arrive in alternative high schools after, or right before, that predetermined test year or may have missed the test due to truancy during that year.
When identifying appropriate solutions to support students in alternative high schools, the flexibility in ESSA provides an opportunity to identify measures that are better tailored to the needs and experiences of students, including those who are enrolling after repeated failures. Furthermore, the U.S. Department of Education has, in limited cases, provided flexibility to states to design new testing systems, an effort taken on by the state of New Hampshire, which submitted a federal waiver to the education department to pilot a statewide performance-based assessment system.26
To measure academic proficiency, states should create an index for alternative high schools that follows the recommendations below.
- Calculation. Provide an option27 to assess proficiency through performance-based assessments measured with standardized rubrics that are aligned to the state’s academic standards and to use statewide assessment where necessary.
- Cohort. Use a single-year exit or targeted exit cohort.
- Attribution. Attribute student data to schools if their enrollment period exceeds a minimum threshold determined by the state.
- Comparison. Upon developing sufficient sample size, consider establishing a peer comparison benchmark or subgroups against which assessment outcomes above are compared to measure outcomes.
Calculation: Performance-based assessments using standardized rubrics
Performance-based assessments (PBAs) provide a more interactive and responsive mode of assessment than the standardized tests that many alternative high school students have previously failed. States should use standardized, valid, reliable rubrics to score practitioner-designed PBAs to determine academic proficiency. New Hampshire, for example, recently used a limited waiver from the federal government to move some schools to PBAs.
States can further draw on the pioneering work of the New York Performance Standards Consortium and their development of performance-based assessment tasks (PBATs). PBATs are projects or portfolios of learning that students must complete to demonstrate in-depth mastery of cognitive skills and knowledge aligned to the New York state standards. For example, a PBAT might be a comparative analytical literary essay or real-world application of mathematical principles. Students completing PBATs must first submit their work to a committee at their school that includes their own teachers and then defend their work in an oral presentation to at least two additional external assessors. While teachers design the PBATs for, and at times with, their students, a final grade is assigned using a standardized rubric designed to measure standards-aligned skills. When used for accountability purposes, this final grade can be translated to a pass or fail.
Like much in education, designing and administering performance-based assessments requires significant investment of effort on the part of teachers. Whereas standardized assessments require teachers to develop instruction that builds to the assessments, standardized rubrics for scoring teacher-designed assessments require commitment and effort by teachers to develop both instruction and assessments. In New York City, various efforts are made to ensure reliability of the assessment scoring. Consortium teachers convene annually to review and evaluate materials, a board of national assessors with relevant expertise provides additional oversight, and validity is established through analysis of post-graduation data.
Federal law requires that every student be assessed using a valid and reliable assessment aligned to the full range of the state’s academic standards. States make use of a variety of methods to meet this requirement. For example, states could use the standardized assessment in English but a PBA for math. Preparing students to show proficiency on both performance-based assessments and standardized assessments can pose a significant challenge, a challenge that should be taken into account when considering testing requirements for assessments in alternative high schools.
Cohort: Inclusion of all enrolled students prior to exit
As with graduation, conventional cohorts that work for other high schools can be problematic for alternative high schools. Most high schools meet the federal requirement that they assess students in math and English in one predetermined year by setting, for example, 10th or 11th grade as a testing year for a given subject. For alternative high schools, student assessment is not as simple. At the time they enroll, students may have already passed or failed the test in the predetermined grade, they may have not yet reached the predetermined grade, or they may have reached it and missed the test because of truancy or other issues. For accountability purposes for alternative high schools, we recommend states employ the same cohort options described in the previous section on graduation: either reporting test scores for all students attained by the year they exit the school, or reporting test scores for all students attained by a year determined by their credit level when they entered the school.
Attribution: Minimum enrollment period
As with the discussion in the prior section on graduation, attribution of students in schools with a transient population is a complicated matter. How long should a student be enrolled in a given school for their performance on an assessment to be attributed to that school? If attribution shifts on the first day of enrollment and students bring prior assessment data with them to their new school, this school would arguably be held accountable for assessment results from tests that students took long before entering their building. If states develop systems in which academic proficiency is used for accountability purposes in the year in which a student exits a school, states should consider attributing only students who have passed a reasonable minimum threshold of days enrolled.
Comparison: Peer benchmarks or groups developed over time
The prior section on graduation recommends using peer benchmarks, if possible, or comparison groups based on student status at time of enrollment. Should states use standardized assessments in alternative high schools, we recommend using similar methods for comparison for similar reasons. If states move to academic proficiency measured by performance-based assessments, such comparisons would not be possible until a large sample had been developed using these rubrics. For such states, creating peer benchmarks would be a valuable step in understanding the reliability of standardized rubrics and could be developed over multiple years as sample size grows.
School quality and student success
ESSA requires states to use at least one indicator of school quality and student success that generally does not measure academic proficiency, growth and graduation. States should consider carefully chosen combinations of measures of attendance, credits, and surveys:
- Calculation. Include a combination of metrics that measure aspects of attendance, credit accumulation, and student perception of school climate to gauge school quality and student success. Given the high rate of chronic absenteeism for students prior to enrollment in alternative high schools, holding these schools accountable for growth in attendance brings a focus to an important precursor to learning. Given research that improvements seen in grades are statistically the best predictor of future college success,28 schools that can accelerate improvements in grades and course credit learning while maintaining rigor are doing a service to students. Finally, given the importance of school climate in cultivating student success, student surveys can be a valuable data collection tool.
- Attribution. As with other metrics, attribute student data to schools after an agreed period of continuous enrollment determined by the state.
- Cohort. Given that these metrics are based on data throughout the school experience, include all students attributed to the school.
- Comparison. As with other metrics, where appropriate, establish a peer comparison benchmark or subgroups against which measures above are compared.
Calculation: Combine multiple measures of attendance and credits, and consider survey data
Attendance growth
In its progress report for transfer schools, the New York City Department of Education introduced a metric of year-to-year growth in attendance. Importantly, such a measure recognizes progress that students make as they re-engage in learning. As an example, a student who posted 90 percent attendance this year and 70 percent the previous year contributes a +20 to the score.
Attendance change
While the attendance growth measure highlights an important aspect of progress, it has drawbacks. Consider a hypothetical student whose attendance increases from 65 to 90 percent after transferring to an alternative high school. The next year, as he connects with an after-school job preparing him for postsecondary success, attendance drops to a still relatively strong 85 percent. This student’s annual growth in attendance was negative, but the change from his experience before enrollment at the alternative high school is still a great improvement. A change in attendance measure, designed to complement the growth measure, focuses on change in current attendance as compared to attendance in the year prior to enrollment in the alternative high school. This measure, too, has its drawbacks, including the fact that attendance data prior to transfer to an alternative high school can be hard to define and hard to capture accurately as students transfer with varied gaps in their attendance records. Indeed, New York City originally included this measure in its early transfer school progress reports then moved away from it to only a growth measure.
Attendance strength
A drawback of measuring either change or growth is that these are relative measures of improvement but not absolute strength. Research points to the importance of consistent attendance as a key predictor of student success, as well as to the drawbacks of chronic absenteeism.29 This measure of “attendance strength” counts as a positive for a school every student who posts an attendance rate of 90 percent or better (the threshold below which the federal government would consider the student chronically absent).30
Credit Accumulation
New York City’s transfer school accountability report highlights the number of credits students accumulate annually, out of the 44 total needed to graduate. Every credit accumulated is a step toward graduation. By holding schools accountable for students earning credits, this measure recognizes credit accumulation as a key indicator of student success. By focusing only on credit earning, however, without considering grades, this measure runs the risk of incentivizing schools to lower standards such that increases in credits represent not an increase in learning but a decrease in rigor.
Credit Acceleration
While credit accumulation is a measure of absolute performance, credit acceleration is a complementary measure of relative performance compared to a student’s past. While this measure has not been tested in New York City, it is proposed to bring balance to an accumulation metric. It defines a targeted number of credits to earn annually as one quarter of the total credits needed to graduate, then compares the percent of this figure for a student in their history before they enrolled to the current year. For example, take a state in which students are expected to earn five credits per year to graduate; a student who earned three credits in her first year (60 percent of the expected total), then transfers to an alternative high school and earns four credits (80 percent of the expected total) in her second year, would contribute +20 percent to the metric that year.
Student surveys on school environment
New York City administers a district-wide School Environment Survey annually to every public-school parent, teacher, and student in sixth grade and above. Results are collected in the spring and individual responses are kept confidential, with tabulations averaged according to themes that align to the Consortium on Chicago School Research’s five essential supports for school improvement: supportive environment, collaborative teachers, effective leadership, rigorous instruction, strong family-community ties, and trust.31 Schools are given overall scores from 1 to 4 based on the degree to which the percent of positive responses in a given theme matches or exceeds a citywide average. These surveys provide a valuable lens for understanding the culture and climate of individual schools. They also provide insight into student beliefs about the school environment and learning, which research has shown to be a strong predictor of students’ future success.32
However, because surveys rely on student self-reporting, there are risks that these will be manipulated by those administering them. Self-report surveys are often unreliable because they lack standardization and depend heavily on subjective experience.33 In addition, context matters significantly in these responses, such that inter-school comparisons require several years of data and may reveal more about how schools differ in their culture of survey-taking than about how they differ in their culture of learning.
States should continue to explore and refine survey measures with a goal of ultimately including the rich insights that can be gleaned through surveys in measures of school success. An initiative that the New York City school district has led in partnership with Eskolta School Research and Design and the Carnegie Foundation for the Advancement of Teaching for the last five years, called the Academic and Personal Behaviors Institute (APBI), helps to provide insight. While this initiative has not been part of a high-stakes accountability system, it does employ student survey data to inform constructive efforts to improve conditions for learning led by school leaders and teacher teams. In addition to using a valid and reliable survey instrument, this initiative engages in four practices that states should consider in exploring survey use for accountability purposes:
- Measure perceptions in context. Because beliefs are context-specific, it is important to name context in survey questions. In the APBI surveys, students are asked questions in relation to both their generalized beliefs about schools and their beliefs about specific classroom environments. For example, a survey might include the statement, “Teachers believe that all students can succeed,” as well as, “My math teacher believes that all students can succeed.”
- Enable formative and responsive use. Surveys that plumb student perceptions call for educators and counselors who respond meaningfully. This is especially true in alternative high schools where students may feel that concerns they expressed in the past were ignored. The APBI instrument includes various questions that are used exclusively for school staff to review responses and engage in improvement efforts for their students.
- Clearly shield student identity. While responses used for formative support should be shared transparently with schools, responses that are used for accountability purposes should be kept strictly confidential and clearly distinguished as such. Because of the nature of self-reported surveys, such confidentiality is critical for students to feel comfortable responding honestly to high-stakes questions.
- Solicit school-based modifications. Feedback from educators is routinely solicited in revising approaches to the APBI survey. Educator voice in designing some questions helps to make the surveys actionable for school teams. Questions are at times included that are of value to the school site even if they have not been validated for accountability purposes. In an accountability system, such questions could be included in individual school surveys and reporting, but ultimately excluded from analysis for accountability purposes.
Attribution: Minimum enrollment period
As with the discussion in the prior section on graduation, attribution of students in schools with a transient population is a complicated matter. In the case of measures of attendance and credits, data that is and ought to be transparent to students, states should consider attributing only students who have passed a reasonable minimum threshold of days enrolled. In the case of surveys, while a minimum enrollment period is also logical, it is complicated by the fact that individual survey responses should be kept confidential in order to increase the chance of accurate reporting by students.
Cohort: Inclusion of all attributed students
Students enrolled in an alternative high school should experience the school climate and post grade and attendance data within months of first enrollment, regardless of exact entry or exit date. In order to ensure accountability for school quality and student success, we recommend states consider all attributed students for annual calculations.
Comparison: Peer benchmarks or groups developed over time
The prior sections recommend using peer benchmarks, if possible, or comparison groups based on student status at time of enrollment. For consistency and simplicity in review and analysis, we recommend using similar comparison groups for these measures, except in cases in which confidentiality of data precludes individual comparison, as discussed in the previous paragraph.
Recommendations
States and districts undertaking the design of accountability systems for alternative schools should consider the following:
- Consider whether measures for alternative schools can include those suggested in this report: indices for graduation rate; academic proficiency; and school quality and student success.
- Develop a uniform definition of alternative schools for the state, including the student population served, educational setting and programmatic characteristics—for example, serving bilingual students, serving students who are young but far behind, serving students who are older and far behind, providing evening or distance education, emphasizing mental health services, and more.
- Work in partnership to combine data of sufficient size and scope (at least roughly 50,000 students and two or three years of data) to make statistical analyses reliable and more sophisticated benchmark comparisons realizable, especially for states and districts with few alternative schools or small student populations. Partnering states or districts need a memorandum of understanding or other documentation around data sharing, including the business rules for data, for example, confidentiality and data coding. States working in partnership would need the same definition of alternative schools in their states.
- Pilot and validate measures before committing to them as part of an accountability system. Use the initial pilot years to afford time to refine measures and definitions, as well as to develop confidence and comfort with measures from practitioners who abide by them.
- Gather explicit feedback from school leaders and teachers on the process of collecting and using the data for administrative and programmatic decision-making.
The federal government, when considering the next reauthorization of ESSA, should:
- Consider providing authority for states to engage in a pilot of accountability indicators for alternative high schools, like the authority granted to develop innovative assessments.
Conclusion
New York City’s example of measuring progress in transfer schools provides an encouraging illustration of how state and district leaders can build differentiated accountability systems for alternative high schools using measurements that are authentic to student experiences.
While one can always dream of perfection, a system that has a 100 percent success rate for every student in each school can be difficult to create. That is why there are alternatives for students who are not able to succeed in conventional schools. At the same time that these alternative schools must be held accountable, they must be measured fairly and accurately given their particular circumstances and the unique role they play within the system. By considering carefully how to modify calculations, cohorts, attribution, and comparisons for alternative high schools, states can ensure that measures do not condone or hide failure but instead credit those who embrace students who failed in other settings and give them a genuine second chance to meet rigorous expectations.
Alternative schools take on the challenges many other schools cannot tackle. States, therefore, have a responsibility to create fair and balanced accountability systems that push these schools to help students do better while not undermining their commitment to serve the most vulnerable students. Having authentic measures of progress is critical to customizing the supports that alternative schools need to improve student outcomes. Employing unique systems of accountability for alternative schools sends a signal that the progress of these students matters. Doing so reflects a commitment to equity in education and to the belief that all children are entitled to a high-quality education that prepares them for college, careers, and life.
About the authors
Laura Jimenez is the director of standards and accountability at the Center for American Progress
Michael Rothman is the executive director of Eskolta School Research and Design.
Erin Roth is a senior policy analyst at the Center.
Scott Sargrad is a managing director of K12 education policy at the Center.
Except where otherwise noted, all data on New York City high school students were provided by the New York City Department of Education (NYCDOE) and analyzed by Eskolta School Research and Design. The authors wish to thank the NYCDOE for providing these data.
Appendix: Methodology
National picture of alternative schools
CAP downloaded and merged public Common Core of Data (CCD) files from the National Center of Education Statistics for the 2014-15 academic year to compute national descriptive information about alternative high schools. CCD files include an indicator variable for school type and the grades of students enrolled to identify alternative schools and high schools. The authors identified schools that enroll either 11th or 12th grade students as high schools rather than the traditional school level variable. Many alternative schools serving upper-secondary grades are not captured within the traditional high school level variable; however, identifying schools with either 11th or 12th grade students did capture most alternative schools serving high school-age students.
Total sample
For analysis of over-age, under-credited students, the sample consists of 68,163 students who met the following three criteria:
- They appeared in the 2008 six-year graduation cohort of 79,233 students, according to the 2013-14 state graduation calculation table provided by NYCDOE representing the New York State Regents cohort.
- Of the above, a total of 3,187 students whose names or school names did not appear in the biographical data files provided by the NYCDOE in all four of the following years were excluded from the sample, due to lack of data to establish age and attendance: 2008-09, 2009-10, 2010-11, 2011-12.
- An additional 7,883 students were excluded who never attended a general education, career technical, or transfer school in New York City, according to the biographical data files provided by the NYCDOE for 2008-09, 2009-10, 2010-11, 2011-12, 2012-13, and 2013-14. According to the biographical data files provided by NYCDOE, these students exclusively attended some combination of special education schools, homeschooling, charter schools, or did not have school records listed in this time period. Homeschooling and special education were omitted for definitional reasons. Charter schools were omitted because of missing credit attainment data.
Graduation
For the purposes of these calculations, six-year graduation rates were used, based on the 2013-14 state graduation calculation table representing the New York State Regents cohort, as provided by the NYCDOE. As a result, students who continued to be enrolled beyond six years were not counted as graduates in these calculations, regardless of their ultimate school completion outcome.
Over-age, under-credited
For the purposes of this discussion, over-age, under-credited (OAUC) is defined as high school students whose combination of age and credit attainment places them two or more years behind expectations. In New York City, where 44 high school credits are required for graduation, this includes students age 16 with less than 11 credits, age 17 with less than 22 credits, age 18 with less than 33 credits, or age 19 or older and still enrolled in high school. Note that the NYCDOE, in its definition of OAUC, uses a different set of criteria that includes not only age and credits but also passing rates on the state’s five exams required for graduation, and incarceration status.
- Age as of December 31 or each year was determined based on biographical data files provided by the NYCDOE. Students with biographical data in at least one of the following years were included: 2008-09, 2009-10, 2010-11, or 2011-12.
- High school credits earned in high school were based on data provided by the NYCDOE for the 2008-09, 2009-10, 2010-11, 2011-12, 2012-13, and 2013-14 school years. Note that credits that were awarded erroneously by schools—including credits awarded more than one time for the same state requirement—were counted in these calculations due to lack of available data to discern these errors.
- High school credits earned in eighth grade were estimated following the district’s academic policy on crediting of high school and LOTE (language other than English) exams passed in eighth grade. This was based on Regents records provided by the NYCDOE for the 2007-08 year for every high school student in New York City.
- Students who were missing credit data in a single year were not considered over-age under-credited in that individual year (typically because of lack of enrollment or enrollment in a charter school); however, because of New York City requirements that credits be entered upon enrollment, these students were counted in ensuing years.
Reporting of school transfers
For various purposes in this paper, date of transfer is discussed. This date was calculated using biographical data files provided by the NYCDOE for every student enrolled in New York City public schools in 2007-08, 2008-09, 2009-10, 2010-11, 2011-12, 2012-13, and 2013-14. In each year, a single school of record is listed for each student in the provided data file.
- Students whose school of record, identified based on the borough and number of the school as assigned by the NYCDOE, changed from one year to the subsequent year were determined to have transferred.
- Due to limitations in data provided, unidentified schools in this dataset include educational programs in institutional settings, defined in New York City as District 79, including penitentiaries, some programs for parenting teens, and some high school equivalency programs.
- Students whose school of record changed to an unidentified school and remained in an unidentified school for all subsequent years on record were assumed to have been discharged and the final transfer was therefore not counted.
- Students who were in unidentified schools for up to four consecutive years starting in 2007-08 were assumed to have arrived in New York City from outside the district and the first arrival school was not counted as a transfer.
- Note that actual number of transfers is undercounted, given that some students may have multiple transfers in a single year, which were not noted in the dataset provided.
Calculation of year of transfer to alternative high school
Definition of a school as an alternative high school was determined based on the NYCDOE Location Code Generation and Management System (LCGMS) file which identifies all New York City schools by type. Any school listed as a “transfer school” in this dataset was deemed to be an alternative high school. Given that the entire sample focused on the 2008 cohort, year of high school at transfer was determined as the first school year in which a student’s school of record according to the biographical data file was one identified as a “transfer school” according to LCGMS. Note that for the purposes of this analysis, only the first transfer was counted; if a student changed attendance in multiple years, the first of these changes to a transfer school was counted as the “enrollment year at time of transfer.”
Determination of over-age status prior to transfer
Students were identified as being over-age and under-credited (OAUC) prior to transfer if calculation of OAUC status using the methodology described above determined the student to be OAUC in any given school year prior to or during the year in which the student transferred, with year of transfer calculated using the methodology described above.
Determination of chronic absence at time of transfer
Student attendance for each year was calculated based on data provided by the NYCDOE in biographical data files for every student enrolled in New York City public schools in 2007-08, 2008-09, 2009-10, 2010-11, 2011-12, 2012-13, and 2013-14. In each year, student days enrolled and days absent are provided in the dataset. Attendance rate was calculated as the percentage of days not absent out of total days enrolled. Students were considered to have transferred based on the methodology described above for reporting of school transfers. Students were considered chronically absent in the year of transfer if they had attendance data available in the year of transfer and that data yielded an attendance rate under 90 percent.
Calculation of subgroups. This paper discussed three subgroups: students who are continuously enrolled, those who have disrupted enrollment, and those who are over-age at the time of disrupted enrollment. Size of each cohort was calculated as follows:
- Disrupted enrollment was defined as any student in the sample who had a school transfer within that student’s enrollment period (calculated using the methodology described above for reporting of school transfers).
- Over-age disrupted enrollment was defined as any student who fit the definition of disrupted enrollment and was determined to be over-age and under-credited in the year immediately prior to school transfer or the same year as school transfer (calculated using the methodology above for overage under-credited). Because the dataset provided does not pinpoint exact date of school change, both years were considered for this calculation.